J.ophthalmol.(Ukraine).2017;4:3-8.
|
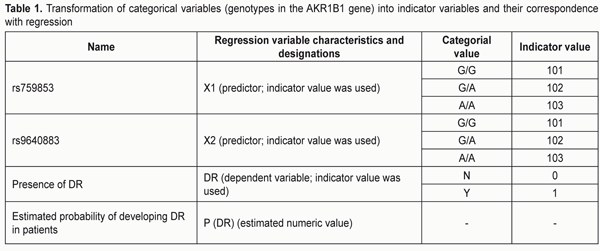
https://doi.org/10.31288/oftalmolzh2017438 Predicting the development of diabetic retinopathy based on identification of rs759853 and rs9640883 in the AKR1B1 gene S.Iu. Mogilevskyy1, Dr Sc (Med), Prof., O. V. Bushuieva 2, Assistant 11Shupik National Medical Academy of Postgraduate Education 2Danylo Halytsky Lviv National Medical University E-mail: sergey.mogilevskyy@gmail.com Background: Currently, up to 50% of the risk for developing diabetic retinopathy (DR) is attributed to genetics. Identification of patients predisposed to develop DR could facilitate the development of individualized approaches to prevention and treatment of the disease. Associations of the AKR1B1 SNPs rs759853 and rs9640883 with DR have been reported previously. Purpose: To predict the development of DR based on identification of these SNPs in the AKR1B1 gene. Materials and Methods: Four hundred and nine patients were involved in the study. Group 1 comprised 281 patients without DR, and Group 2 comprised 128 patients with DR. TaqMan Mutation Detection Assays (Thermo Fisher Scientific) were used to analyze polymorphic DNA loci in a Real-Time PCR System (7500 system; Applied Biosystems, Foster City, CA). A multiple logistic regression model was built and analyzed to analyze the relationship of the genotype with the risk for developing DT. Statistical analysis was performed using Statistica 10 (StatSoft, Inc., USA) and SPSS Statistics 22 (IBM Corp., USA). Results: A multiple regression model for predicting the development of DR demonstrated sufficient reliability of the effect of independent variables on the estimated index: -2 ? log(likelihood) = 354.467 (?2=42.877; p<0.001), AUC=0.70±0.03 (95%CI: 0.62-0.76), p=2.6E-09. The highest probability for developing DR was observed in A/A rs759853*G/G rs9640883 haplotype (PDR = 0.610), followed by G/A rs759853*G/G rs9640883 haplotype (PDR = 0.407) and А/A rs759853*G/А rs9640883 haplotype (PDR = 0.389). The lowest probability for developing DR was noted in G/G rs759853*A/A rs9640883 haplotype (P (DR) = 0.047). The estimated probability exceeding a threshold of 0.231 identified the presence of DR, and that below or equal to 0.231 identified the absence of disease with a total prognostic accuracy of 66%. Conclusion: The AKR1B1 rs759853 and rs9640883 can be used for predicting the development of DR. A model for estimating the probability of the disease was proposed. Keywords: diabetic retinopathy, AKR1B1, rs759853, rs9640883, prognostic regression models Introduction Type 2 diabetes mellitus (T2DM) accounts for more than 90% of all cases of diabetes mellitus, and is a multifactorial disease which is influenced also by genetic factors [1]. Currently, up to 50% of the risk for developing diabetic retinopathy (DR) is attributed to genetics [2, 3]. Identification of patients predisposed to develop DR could facilitate the development of individualized approaches to prevention and treatment [4]. Several studies have demonstrated in different populations that heredity has a role in the development of DR, and that this role does not depend on the hyperglycemia level and on other environmental factors contributing to the risk [5, 6]. The polyol pathway of glucose metabolism is a mechanism driven by hyperglycemia, and has been implicated as a contributor to diabetic complications [7, 8]. Aldose reductase, the first enzyme in the pathway, reduces glucose to sorbitol using nicotinamide adenine dinucleotide phosphate (NADPH) as a cofactor [1, 8]. Intracellular accumulation of sorbitol is a consequence of hyperglycemia and results in dysregulation of osmotic homeostasis, playing an essential role in the development of DR [1]. The AKR1B1 is located on chromosome 7q35 and has 10 exons which span 18 kb of DNA [9]. Associations of the AKR1B1 SNPs rs759853 and rs9640883 with DR have been reported in the literature in different populations [5, 6]. Previously, we have established associations of these SNPs with DR in the Ukrainian population [10]. Building a multiple logistic regression model for predicting the development of DR is the next phase of our research. The study purpose was to predict the development of DR based on the identification of the SNPs (rs759853 and rs9640883) in the AKR1B1 gene. Materials and Methods The clinical study was conducted at the Department of Ophthalmology of the Danylo Halytsky Lviv National Medical University. The molecular genetics study was conducted at the Research Institute for Experimental and Clinical Medicine of the Bohomolets National Medical University. Severity of diabetic retinopathy was graded as per the 2003 guidelines of the American Academy of Ophthalmology. Ophthalmological examination included visual acuity assessment, Goldmann tonometry, static Humphrey perimetry (Carl Zeiss Meditec, Dublin, CA), slit lamp biomicroscopy (BQ 900; Haag-Streit, K?niz, Switzerland); gonioscopy; ophthalmoscopy with contact and non-contact lenses (Volk Optical, Mentor, OH); optical coherence tomography (Optovue, Inc., Fremont, CA); and fundus photography (the ETDRS seven standard fields) and fluoresecent angiography with the fundus camera TRC-NW7SF (Topcon, Tokyo, Japan). TaqMan Mutation Detection Assays (Thermo Fisher Scientific) were used to analyze polymorphic DNA loci in a Real-Time PCR System (7500 system; Applied Biosystems, Foster City, CA). The rs759853 polymorphism of the AKR1B1 gene is located on chromosome 7q35 (Chr. 7:134143958 as per NCBI Build 37). This is a G-to-A SNP in an intron of the AKR1B1 (NM_001628.2: c.-144 C>T). The rs9640883 polymorphism of the AKR1B1 gene is located on Chr.7:134116633 as per NCBI Build 37. This is a G-to-A SNP in an intron of the AKR1B1 (XR_928003.1: n.94+433 C>T). A multiple logistic regression model was built and analyzed to analyze the relationship of the genotype with the risk for developing DT. Four hundred and nine patients were divided into two groups based on the presence or absence of DR. Group 1 comprised 281 patients who had attended our clinic to have their visual function assessed, and had age-related degenerative changes, cataract, etc, but no DR. Group 2 comprised 128 patients with DR. Logistic regression was performed using the presence of diabetic retinopathy (Y) as a dependent variable (Y=0 for patients without DR; Y=1 for patients with DR). In addition, the genotypes of rs759853 and rs9640883 were used as independent variables. Statistical analysis was performed using Statistica 10 (StatSoft, Inc., USA) and SPSS Statistics 22 (IBM Corp., USA). Specialized modules were used to build multiple nonlinear regression models. Results and Discussion To facilitate modeling with logistic regression, categorical variables were transformed to numerical variables (indicator variables) (Table 1). The regression coefficients were calculated using maximum likelihood estimation.
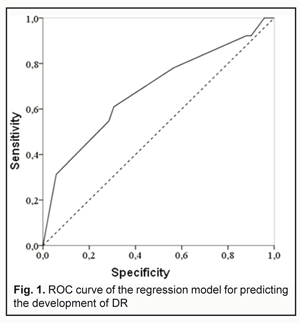
During regression modeling, the influence of predictors on the dependent variable “DR” (presence of diabetic retinopathy) was analyzed. Calculated regression coefficients were highly significant compared to the null hypothesis: t=4.032; p<0.001 and t=-3.166; р=0.002 for ?1 and ?2, respectively (Table 2). Regression coefficients ?1 and ?2 reflecting the relative contribution of a respective predictor (Х1 or Х2) on the dependent variable (DR) were approximately the same in magnitude, but had opposite signs: ?1=0.827±0.205 (95% CI: 0.424 to 1.230) and ?2=-0.899±0.284 (95% CI: -1.457 to -0.341). In general, the main characteristics of multiple regression demonstrated sufficient reliability of the effect of independent variables on the estimated index: -2 ? log(likelihood) = 354.467 (?2=42,877; p<0,001). Operational characteristics of the model are presented in Fig. 1.
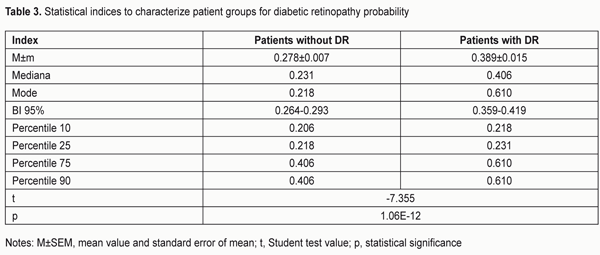
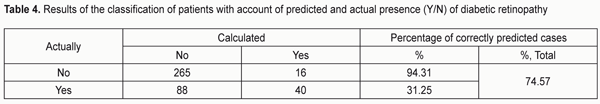
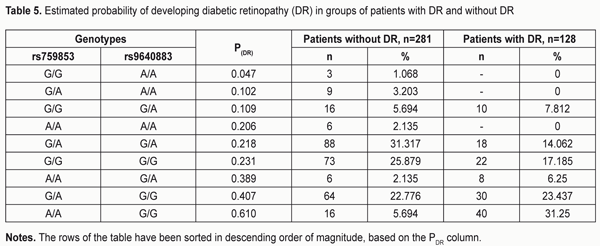
The area under curve (AUC) confirmed satisfactory characteristics of the developed model (AUC = 0.70 ± 0.03 (95% CI: 0.62 to 0.76) which were statistically significantly different (p = 2.6E-09) from those of the null hypothesis (АUC = 0.5). The results obtained allow presenting the formula for the estimated probability of developing DR (Yes/No) in the following way: "PDR =1/(1+" e^"(?0+?1*X1+?2*Х2)" ") (1)" where PDR is estimated probability of developing DR; X1 is the indicator value for rs759853; X2 is the indicator value for rs9640883; ?0, ?1, ?2 are regression coefficients. We believed it was practical to use the regression formula obtained for comparison of estimated probability of developing DR in patients without DR versus those with DR, and to determine cut-off values for presence and absence of the molecular and genetic background for developing DR. With this in mind, we performed statistical analysis of PDR in comparison groups, and classification analysis of distribution of patients based on the actual presence or absence of DR corresponding to estimated probability of developing DR. The results of these analyses are presented in Table 3 and 4, respectively. The comparison of estimated PDR values in the group of patients without DR and the group of patients with DR demonstrated statistically significant differences (t=-7.355; p=1.06Е-12) between mean estimated probabilities of developing DR: 0.278±0.007 (95% CI: 0.264-0.293) and 0.389±0.015 (95% CI: 0.359-0.419), respectively. A similar conclusion can be made when considering the values of Median, Mode and 10th to 75th Percentiles. Although the total percentage of correct outcomes was rather satisfactory (74.57%), the estimated probability of developing DR was low compared to the actual value (31.25%). Therefore, the following should be taken into account. A dependant variable of logistic regression corresponds to the probability (with a value between 0 and 1) for the event, that is, whether the disease (DR) will develop, whereas the estimated probability of developing DR above which the score is considered positive corresponds to the cut-off point and is usually taken above 0.5. However, in practice, it is important to determine the cut-off value that meets the optimality requirements for prognostic models. In addition, the balance between false (false-positive and false-negative) “alarms” and the likelihood of making a correct prediction should be maintained. Determination of a cut-off point depends on a specific study purpose, clinical situation, used indices, and acceptable percentage of positive prediction errors. With consideration of this, we considered the distribution of patients in “actual DR” and “no actual DR” groups depending on the estimated probability of developing DR (i.e., PDR), and, therefore, depending on the genotypes of the two SNPs in the haplotypes found in our patients (Table 5).
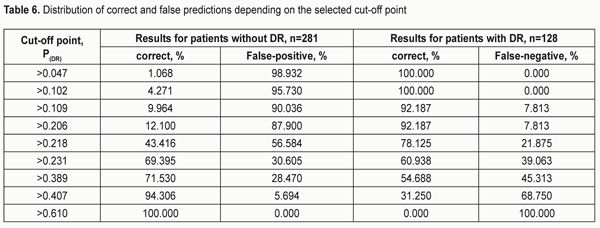
The highest probability for developing DR was observed in A/A rs759853*G/G rs9640883 haplotype (PDR = 0.610), followed by G/A rs759853*G/G rs9640883 haplotype (PDR = 0.407) and А/A rs759853*G/А rs9640883 haplotype (PDR = 0.389). The lowest probability for developing DR was noted in G/G rs759853*A/A rs9640883 haplotype (PDR = 0.047). Table 6 presents the distribution of false-positive and false-negative prognoses for developing DR depending on the cut-off value. Analysis of the data presented in the table demonstrates that the number of patients with correctly predicted development of DR and the sensitivity of the developed model increase with increase in cut-off value. At the same time, model specificity decreases, i.e., the number of correct negative predictions decreases, while the number of false-negative predictions decreases. Models with high sensitivity are usually effective for positive predictions, whereas those with high specificity are more effective for negative predictions. The best balance between sensitivity and specificity can be set with the help of the diagram presented in Fig. 2. Therefore, the value of the estimated probability for developing DR (РDR ? 0.231) obtained with the developed regression identified the presence of disease with a total prognostic accuracy of 66%.
Conclusion First, a multiple regression model for predicting the development of DR demonstrated sufficient reliability of the effect of independent variables on the estimated index: -2 ? log(likelihood) = 354.467 (?2=42.877; p<0.001), AUC=0.70±0.03 (95%CI: 0.62-0.76), p=2.6E-09. Second, the highest probability for developing DR was observed in A/A rs759853*G/G rs9640883 haplotype (PDR = 0.610), followed by G/A rs759853*G/G rs9640883 haplotype (PDR = 0.407) and А/A rs759853*G/А rs9640883 haplotype (PDR =0.389). The lowest probability for developing DR was noted in G/G rs759853*A/A rs9640883 haplotype (P (DR) = 0.047).
Third, the estimated probability exceeding a threshold of 0.231 identified the presence of DR, and that below or equal to 0.231 identified the absence of disease with a total prognostic accuracy of 66%. References 1. Pan’kiv VI. [Workshop No. 162. Diabetes mellitus: Diagnostic criteria, etiology and pathogenesis]. IEJ. 2013;8:53-64 Ukrainian 2. Hietala K, Forsblom C, Summanen P, Groop PH. Heritability of proliferative diabetic retinopathy. Diabetes. 2008 Aug;57(8):2176-80 3. Cho H, Sobrin L. Genetics of diabetic retinopathy. Curr Diab Rep. 2014 Aug;14(8):515 4. Liew G, Klein R, Wong TY. The role of genetics in susceptibility to diabetic retinopathy. Int Ophthalmol Clin. 2009 Spring;49(2):35-52 5. Abhary S, Hewitt AW, Burdon KP, Craig JE. A systematic meta-analysis of genetic association studies for diabetic retinopathy. Diabetes. 2009 Sep; 58(9): 2137–47 6. Sladek R, Rocheleau G, Rung J, et al. A genome-wide association study identifies novel risk loci for type 2 diabetes. Nature. 445: 881–5 7. Suzen S, Buyukbingol E. Recent studies of aldose reductase enzyme inhibition for diabetic complications. Curr Med Chem. 2003 Aug;10(15):1329-52 8. Chung SS, Chung SK. Aldose reductase in diabetic microvascular complications. Curr Drug Targets. 2005;6:475 9. Schulkin AV, Kolesnikov AV, Barenina OI, Nikiforov AA. [Genetic markers of diabetic retinopathy]. Fundamental’nye issledovaniia. 2014;4:411-4 10. Mogilevskyy SIu, Bushuieva OV, Ziablitsev SV, Natrus LV. [Relationship of the AKR1B1 rs759853 and rs9640883 with the development of diabetic retinopathy]. Oftalmol Zh. 2017;2:3-7
|