J.ophthalmol.(Ukraine).2021;5:21-27.
|
http://doi.org/10.31288/oftalmolzh202152127 Received: 19 July 2021; Published on-line: 23 October 2021 Morphological, functional and structural changes in red blood cells of type 2 diabetes patients with proliferative diabetic retinopathy and different diabetes duration V. M. Hanyuk 1, O. V. Petrenko 1, L. V. Natrus 2, O. I. Prusak1 1 Shupyk National Healthcare University of Ukraine; Kyiv (Ukraine) 2 Bogomolets National Medical University; Kyiv (Ukraine) E-mail: olga15if@meta.ua TO CITE THIS ARTICLE: Hanyuk VM, Petrenko OV, Natrus LV, Prusak OI. Morphological, functional and structural changes in red blood cells of type 2 diabetes patients with proliferative diabetic retinopathy and different diabetes duration. J.ophthalmol.(Ukraine).2021;5:21-7. http://doi.org/10.31288/oftalmolzh202152127
Background: Hyperglycemia alters erythrocyte membrane properties, and the reduced Na+,K+-ATPase activity results in ionic imbalance and changes in size and osmotic resistance of red blood cells (RBCs), accelerates cell aging, and contributes to impaired microvascular circulation. Purpose: To assess morphological, functional and structural changes in RBCs of type 2 diabetes patients with proliferative diabetic retinopathy (PDR) and different diabetes duration. Material and Methods: One hundred and six type 2 diabetes patients with PDR were included in the study. The control group (n=37) included volunteers without diabetes of age, gender and body-mass-index comparable to patients. Morphological and functional parameters of RBCs were determined using a MicroСС-20Рlus auto hematology analyzer (China). Percentages of hemolysis of erythrocytes in 0.1%; 0.2%, 0.3%, 0.35%, 0.4%, 0.45%, 0.5%, 1.0%, and 0.9% NaCl-buffer solutions were determined. We also determined mechanical chemolysis levels after centrifugation for 2 min and 4 min. Results: At 0.9% NaCl, osmotic hemolysis was 3.0-3.3-fold higher (р < 0.05) in PDR patients than in healthy individuals, but there was no significant difference in osmotic hemolysis between PDR patients with different durations of T2D. At 0.5% NaCl and 0.45% NaCl, PDR patients had percentages of hemolysis that were 3.5-4.0-fold higher (р < 0.05) and 2.0-2.5-fold higher (р < 0.05), respectively, than in controls. At 1.0% NaCl, there was a two-fold difference (р < 0.05) in RBC membrane resistance between patients and controls. In addition, patients with diabetes duration of 18 to 20 years were found to have erythrocytes with the highest resistance to damage. The percentages of hemolyzed RBCs after centrifuging for 2 min were 2.6 to 3-fold higher, and after centrifuging for 4 min, 3.0 to 3.75-fold higher, in patients relative to those in control subjects Conclusion: Compared to controls, patients with PDR exhibited signs of a relatively short residence time of RBCs in the circulation due to early cell membrane damage. The reduced structural resistance and loss of capability for effective perfusion in RBCs in the presence of PDR leads to a further impairment of microcirculation. Keywords: osmotic, mechanical hemolysis, hyperglycemia, glycated hemoglobin, impaired microcirculation
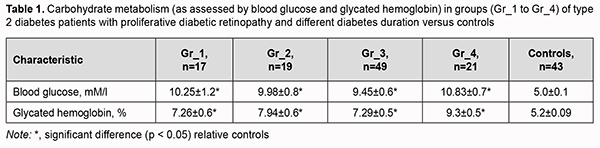
Introduction Diabetic retinopathy (DR) is the most common microvascular complication of type 2 diabetes mellitus (T2D) and still a leading cause of blindness among working-age adults. The global diabetes prevalence in 2019 was estimated to be around 9% (463 million people), rising to around 11% (700 million) by 2045 [1]. Diabetic retinopathy is identified in a third of people with diabetes and associated with increased risk of life-threatening systemic vascular complications, including stroke, coronary heart disease, and heart failure [2]. A diabetes duration exceeding 5 to 10 years results in a worsening of DR severity to the proliferative form, which is characterized by neovascularization arising from the optic disc and the retina, potentially resulting in preretinal and vitreous hemorrhage [3]. A comprehensive approach to the treatment of proliferative diabetic retinopathy (PDR) is important and should include not only eye care and endocrinologic correction, but also target other pathogenetic mechanisms of the disease. Therefore, a search for effective influences on the non-vascular mechanisms of PDR may lead to offering opportunities for patients to improve their condition and delay further worsening of vascular disease. The erythrocytes in diabetic patients face multiple risks, such as hyperglycemia, hyperosmolarity, oxidative stress, inflammation, and lipid metabolism disorder, which lead to increased aggregation, reduced cell deformability, and reduced membrane fluidity. These changes in erythrocytes eventually give rise to microcirculation disorder and diabetic complications [1]. As an important component of blood circulation, erythrocyte is a sensitive indicator of the body's health status. Some erythrocyte parameter indicators, such as hemoglobin (Hb) concentration, hematocrit, and erythrocyte sedimentation rate (ESR), can be measured directly from the blood, whereas some parameters, such as mean cell volume (MCV), mean cell Hb, or mean cell Hb concentration, can only be calculated from multiple measured metrics. These parameters reflect the state of erythrocytes from various angles and can be primarily used to assess the morphology, structure, function, and production of erythrocytes for the further diagnosis of some diseases [4]. It has been demonstrated that the deformability as well as membrane flexibility of erythrocytes in patients with DM was reduced [5], further worsening the risk of diabetic complications. By observing changes in the morphology and structure of erythrocytes in diabetics, a better understanding of the progression of PDR can be achieved [6]. Hyperglycemia alters erythrocyte membrane properties, leading to increased osmotic fragility of erythrocytes. The significantly reduced Na+,K+-ATPase activity may result in ionic imbalance and changes in size and osmotic resistance of red blood cells, and accelerate cell aging, thus contributing to impaired microvascular circulation [7,8]. The purpose of this study was to assess morphological, functional and structural changes in red blood cells of type 2 diabetes patients with proliferative diabetic retinopathy and different diabetes duration. Material and Methods One hundred and six patients diagnosed with PDR were included in the study. Patients underwent visual acuity assessment, refractometry, static Humphrey perimetry, tonometry, and biomicroscopy. In addition, gonioscopy, ophthalmoscopy with a Goldmann contact lens, and macular optical coherence tomography (Topcon DRI OCT Triton, Tokyo, Japan) were performed, if required. A fundus camera was used to examine the retina, and the Early Treatment Diabetic Retinopathy Study (ETDRS) stereoscopic seven-field was used as an imaging and grading protocol for assessment of DR severity score. Fluorescein angiography was performed, if indicated. Hematological and clinical blood studies were performed using standard techniques at the certified laboratories of the Bohomolets NMU Research Institute for Experimental and Clinical Medicine. Morphological and functional parameters of red blood cells were determined using a MicroСС-20Рlus auto hematology analyzer (China). Hemolysis levels in hypotonic NaCl-buffer were determined using a BS-3000 M semiautomatic biochemical analyzer at 500-560-nm. Twenty microliters of venous blood was added to 5 ml of 0.1%; 0.2%, 0.3%, 0.35%, 0.4%, 0.45%, 0.5%, 1.0%, or 0.9% NaCl-buffer, incubated at room temperature for 30 min, and centrifuged at 2,000 RPM for 5 min. The supernatant was transferred to a 10-mm quartz cuvette, and the absorbance of the supernatant was measured photocolorimetrically at 500-560 nm against a blank. The percentage of hemolysis in each tube was calculated using the following formula: The percentage of hemolysis = E x × 100 / E 1 , where E 1 is the extinction of the supernatant in a test tube with 0.1-percent NaCl solution; E x is the extinction of the supernatant in a test tube with the test sample. For modeling various levels of hemolysis, 1.5-ml venous blood samples were collected in sterile blood collection tubes containing heparin and centrifuged for 2 min or 4 min using a vortex (Micro–Spin FV-2400, BioSan, Riga, Latvia). Maximum optical density readings for RBC suspension in 0.1% NaCl saline indicated 100% hemolysis, and those for RBC suspension in 0.9% NaCl saline indicated no hemolysis. Maximum optical dens Patients were divided into four groups based on the duration of T2D: Gr_1 (n=17; mean age, 61.7 ± 2.8 years; diabetes duration, less than 10 years), Gr_2 (n=19; mean age, 62.3 ± 2.2 years; diabetes duration, 10 to 17 years), Gr_3 (n=49; mean age, 64.1 ± 1.5 years; diabetes duration, 18 to 20 years), and Gr_4 (n=21; mean age, 68.1 ± 2.5 years; diabetes duration, above 20 years). The percentage of women in Gr_1, Gr_2, Gr_3 and Gr_4 groups were 55%, 67%, 54% and 65%, respectively. The control group included 37 subjects (percentage of women, 67%) without impaired carbohydrate metabolism (as assessed by glycated hemoglobin) who have completed a preventive health examination at the Bohomolets NMU Clinic and were age, gender and body-mass-index comparable to patients. Data analysis was performed with IBM SPSS Statistics 23 and MedStat software. Shapiro-Wilk test was used to assess data distribution. Comparison of hemolysis characteristics among groups at different concentrations of NaCl was made by ANOVA and Scheffe’s (multiple comparison) or Dunnett’s (vs. control) tests. Data are presented as mean ± standard error of mean. The level of significance p ≤ 0.05 was assumed. This study was done in accordance with the tenets of the Declaration of Helsinki. Results Eye status assessment as per the ETDRS protocol demonstrated that severity of PDR increased with an increase in underlying disease duration. Most patients of Gr_1 and Gr_2 groups had mild or moderate PDR, and most patients of Gr_3 and Gr_4 groups, high-risk or progressive PDR. Although patients received therapy as per endocrinologist’s advice, their glucose and glycated hemoglobin were statistically significantly higher than in controls (Table 1). There was no significant difference in carbohydrate metabolism among the groups of patients. Glycated hemoglobin is currently the gold standard for the assessment of hyperglycemia, and was 15% higher in Gr_4 group than in Gr_1 to Gr_3 groups, which indicated prolonged and persistent hyperglycemia and low efficacy of therapy for diabetes in patients of the former group.
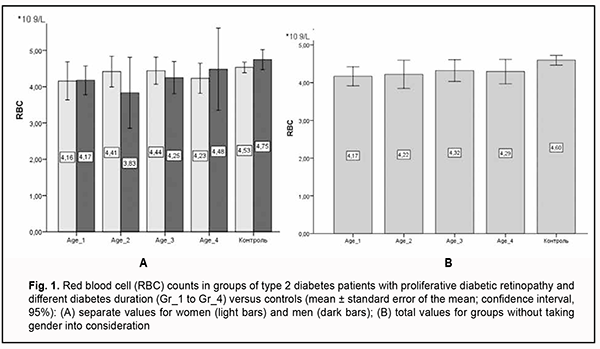
All blood count characteristics were analyzed taking patient gender into consideration because there is a physiological difference in red blood cell parameters between men and women. Here we exemplify only RBC counts in groups taking gender into consideration (Fig. 1). Variation in any blood cell characteristic in men and women was neither significant nor substantial. In addition, in Gr_1 and Gr_3 groups, RBC counts were higher in men than women. We believe that this is natural, because gender differences in red blood cell parameters exist, particularly because of the effect of sex hormones on the intensity of erythropoiesis. As the mean age of patients in our study groups exceeded 60 years, the effect of sex hormones on marrow proliferation was rather low. Therefore, below we report our other studies of RBC parameters without differentiation between men and women.
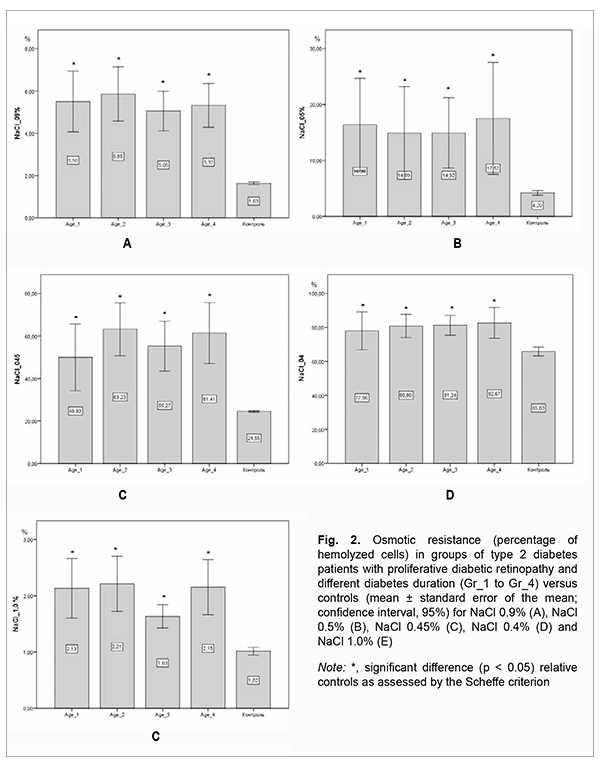
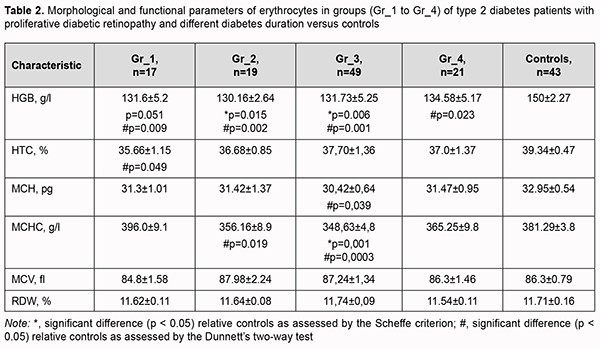
The assessment of morphological and functional RBC parameters demonstrated that quantitative RBC traits like RBC counts, hemoglobin (HGB), hematocrit (HCT), mean corpuscular hemoglobin (MCH), mean corpuscular hemoglobin concentration (MCHC), mean corpuscular volume (MCV), and red cell distribution width (RDW) reflected a clear picture of anemic syndrome by reduced counts of oxygen carrying cells (Fig 1A). There was a significant difference in hemoglobin and hemoglobin-dependent parameters (MCH and MCHC) between patients with PDR and controls. This was likely caused by impaired hemoglobin production in erythroblasts and hemoglobin accumulation in mature erythrocytes. Although there was no clear relationship between diabetes duration and changes in morphological and functional RBC parameters, patients exhibited a steady tendency to reduced hematocrit and RBC counts compared to controls. The above reflects loss of cells from blood flow in the presence of no change in MCV and RDW, anisocytosis parameters, which in turn cause hypoxia in T2D and make us think about the root causes of premature cell aging. The reduced osmotic and mechanical resistance of erythrocytes is a factor causing RBC death and results in cell hemolysis. Therefore, the next phase of the current study was using the standard techniques for assessing the percentage of hemolysis. There was a substantial difference in the structural properties of RBCs between patients with PDR and controls (Fig. 2).
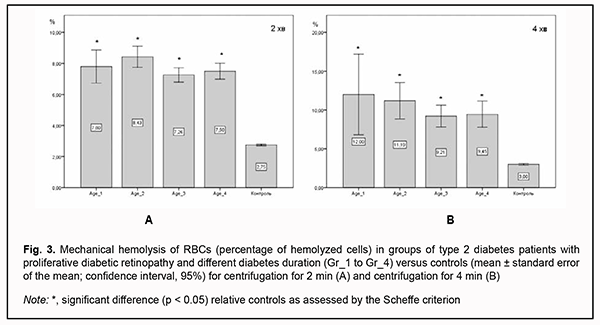
In RBCs with normal osmotic resistance, initial hemolysis is at 0.5% NaCl (minimum osmotic resistance), and complete hemolysis is at 0.35% NaCl (maximum osmotic resistance). At 0.9% NaCl, there was no significant difference in osmotic hemolysis between PDR patients with different durations of T2D, but osmotic hemolysis was 3.0-3.3-fold higher (р < 0.05) in PDR patients than in healthy individuals. At 0.5% NaCl, there was also no significant difference in osmotic resistance of RBCs between PDR patients with different durations of T2D, but PDR patients had osmotic resistance levels that were 3.5-4.0-fold lower (р < 0.05) than in controls. At 0.45% NaCl, PDR patients had osmotic resistance levels that were 2.0-2.5-fold lower (р < 0.05) than in controls, whereas at 0.4% NaCl, osmotic resistance was 20% lower (р < 0.05) in PDR patients than in healthy individuals, with almost 80% of RBCs affected. At 1.0% NaCl, there was a two-fold difference (р < 0.05) in RBC membrane resistance between patients and controls, which increased the percentage of hemolysis in the former compared to the latter. Erythrocytes of patients of Gr_3 group exhibited the best resistance to damage among patient groups, with the percentage of affected RBCs being 1.5-fold higher than in controls (р < 0.05), but there was no significant difference in the percentage of affected RBCs between patients of Gr_3 group and patients of other groups. In addition, there was a substantial difference in RBC membrane resistance to deformation between patients with PDR and controls (Fig. 3). The percentages of hemolyzed cells after centrifuging for 2 min were 2.6 to 3-fold higher, and after centrifuging for 4 min, 3.0 to 3.75-fold higher, in patients relative to those in control subjects. Moreover, RBCs of patients with longer T2D duration were better resistant to prolonged centrifugation, and the percentage of hemolyzed RBCs was 18% higher at the onset of the disease than after years of adaptation of the body to abnormal metabolism.
Discussion An assessment of morphological and functional parameters of RBCs is used in clinical practice in the differential diagnosis of anemia. Blaslov and colleagues [9] demonstrated that both MCV and RDW correlated positively with HbA1c and were also associated with the risk of DR development and progression. MCV has been reported to be a potential risk factor for peripheral artery disease and to be associated with the severity; therefore, it may be used as a predictor of macrovascular complications of diabetes [10]. We, however, found no significant difference in the above parameters between patients with PDR and controls, as well as between patients with different diabetes duration. In addition, patients with PDR tended to exhibit reduced RBC counts and significantly reduced RBC hemoglobin concentration. We believe that this is associated with a relatively short residence time of RBCs in the circulation as well as early cell disruption similar to that described as eryptosis [11]. Qadri and colleagues [50] showed that in patients with diabetes the average life span of erythrocytes was shortened by 13% [12]. Hyperglycemia, increased osmosis and oxidative stress in patients with diabetes alter the concentration of iron and protein inside and outside the erythrocytes and then activate the eryptosis pathway. In patients with diabetes, the main pathways of eryptosis include the calcium ion pathway, platelet activating factor pathway, and caspase pathway; these pathways interact with one another [11]. Increased nonenzymatic glycosylation of intracellular and membrane proteins is an important mechanism of damage to the membrane structure [9]. This primarily affects hemoglobin function and its capacity to release oxygen to the tissues. Glycosylation of spectrin results in irreversible impairment of structural and functional traits of the cell and mechanical cell stability, as well as reduced cell resistance to mechanical damage [13]. The deformability of erythrocytes is due to their special dynamic cell membrane shape and allows them to deliver oxygen to the tissues and organs via microcirculation to ensure effective perfusion. In patients with DR, reduced deformability of erythrocytes contributed to impaired microcirculation [14]. Hyperglycemia results in an increased osmotic fragility of RBCs [15]. This was found due to oxidative modifications of membrane bound proteins in RBCs, the strength and functional properties of membrane may change. The RBC membrane becomes weak and cannot withstand even mild hypotonic condition leading to increased osmotic fragility. Due to this, diabetic patients with poor glycemic control may be at the risk of developing anemia and associated complications. We also demonstrated a substantially reduced osmotic and mechanical resistance of erythrocytes in patients with PDR, which did not depend on diabetes duration, but made a significant difference in functional characteristics of erythrocytes between patients with PDR and control subjects. These findings point to an important role of non-vascular pathogenetic mechanisms in the development and progression of retinopathy, and determine ways and methods for pharmacological correction of microcirculatory complications in the presence of T2D. Therefore, compared with controls, patients PDR showed reduced hemoglobin and characteristics calculated from hemoglobin (i.e., MCH and MCHC), but there was no significant difference in the above characteristics between patients with different diabetes duration. We believe that a tendency to reduced RBC counts in patients with PDR is associated with a relatively short residence time of RBCs in the circulation as well as early eryptosis. At 0.9% NaCl, hemolysis was 3.0-3.3-fold higher (р < 0.05) in PDR patients than in healthy individuals. At 0.5% NaCl and 0.45% NaCl, PDR patients had percentages of hemolysis that were 3.5-4.0-fold higher (р < 0.05) and 2.0-2.5-fold higher (р < 0.05), respectively, than in controls. At 1.0% NaCl, there was a two-fold difference (р < 0.05) in RBC membrane resistance between patients and controls. In addition, patients with diabetes duration of 18 to 20 years were found to have erythrocytes with the highest resistance to damage. The percentages of hemolyzed RBCs after centrifuging for 2 min were 2.6 to 3-fold higher, and after centrifuging for 4 min, 3.0 to 3.75-fold higher, in patients relative to those in control subjects, which indicated reduced structural resistance and loss of capability for effective perfusion, leading to a further impairment of microcirculation. References 1.Wang Y, Yang P, Yan Z, et al. The relationship between erythrocytes and Diabetes Mellitus. J Diabetes Res. 2021 Feb 5;2021:6656062. 2.Cheung N, Mitchell P, Wong TY. Diabetic retinopathy. Lancet. 2010 Jul 10;376(9735):124-36. 3.Waheed N. Proliferative Diabetic Retionopathy. In: Goldman DR, Waheed NK, Duker JS. Atlas of retinal OCT. Edinburgh: Elsevier; 2018. 4.Ford J. Red blood cell morphology. Int J Lab Hematol. 2013 Jun;35(3):351-7. 5.Chang HY, Li X, Karniadakis GE. Modeling of Biomechanics and Biorheology of Red Blood Cells in Type 2 Diabetes Mellitus. Biophys J. 2017 Jul 25;113(2):481-490. 6.Palomino-Schätzlein M, Lamas-Domingo R, Ciudin A, et al. A Translational In Vivo and In Vitro Metabolomic Study Reveals Altered Metabolic Pathways in Red Blood Cells of Type 2 Diabetes. J Clin Med. 2020 May 27;9(6):1619. 7.Rownak N, Akhter S, Khatun M, et al. Study of Osmotic Fragility Status of Red Blood Cell in Type II Diabetes Mellitus Patients. Eur J Environ Public Health. 2017;1(2):6. 8.Kung CM, Tseng ZL, Wang HL. Erythrocyte fragility increases with level of glycosylated hemoglobin in type 2 diabetic patients. Clin Hemorheol Microcirc. 2009;43(4):345-51. 9.Blaslov K, Kruljac I, Mirošević G, et al. The prognostic value of red blood cell characteristics on diabetic retinopathy development and progression in type 2 diabetes mellitus. Clin Hemorheol Microcirc. 2019;71(4):475-81. 10.Kor C-T, Hsieh Y-P, Chang C-C, Chiu P-F. The prognostic value of interaction between mean corpuscular volume and red cell distribution width in mortality in chronic kidney disease. Sci Rep. 2018 Aug 8;8(1):11870. 11.Bissinger R, Bhuyan AAM, Qadri SM, Lang F. Oxidative stress, eryptosis and anemia: a pivotal mechanistic nexus in systemic diseases. FEBS J. 2019 Mar;286(5):826-854. 12.Qadri SM, Bissinger R, Solh Z, Oldenborg P-A. Eryptosis in health and disease: A paradigm shift towards understanding the (patho)physiological implications of programmed cell death of erythrocytes. Blood Rev. 2017 Nov;31(6):349–61. 13.Ferents ІV, Brodyak IV, Lyuta MIa, et al. [Effects of decarboxylated L-arginine on morphofunctional characteristics of the erythron in experimental diabetes mellitus in rats]. Fiziol Zh. 2014;60(4):70-9. Ukrainian. 14.Lee S, Lee MY, Nam JS, et al. Hemorheological approach for early detection of chronic kidney disease and diabetic nephropathy in type 2 diabetes. Diabetes Technol Ther. 2015 Nov;17(11):808-15. 15.Padmini H, Bhagwat K. Monitoring Glycosylated Haemoglobin and Osmotic Fragility with Respect to Blood Glucose Level in Type II Diabetes Mellitus. IJHSR. 2015 Apr;5(4):171-74. Available at: https://www.ijhsr.org/IJHSR_Vol.5_Issue.4_April2015/29.pdf
Conflict of Interest. The authors declare no conflict of interest and own financial interest in the preparation of this article. Sources of Funding. No external sources of funding for this study.
|