J.ophthalmol.(Ukraine).2021;3:3-9.
|
http://doi.org/10.31288/oftalmolzh2021339 Received: 01 April 2021; Published on-line: 29 June 2021 Predictors of the risk of developing diabetic retinopathy in type 2 diabetes mellitus and primary open-angle glaucoma in the course of a comorbid condition K. A. Gudzenko1, S.Iu. Mogilevskyy2 1 Bogomolets National Medical University; Kyiv (Ukraine) 2 Shupyk National Medical Academy of Postgraduate Education; Kyiv (Ukraine) E-mail: gudzenko.k@gmail.com TO CITE THIS ARTICLE:Gudzenko KA, Mogilevskyy SIu. Predictors of the risk of developing diabetic retinopathy in type 2 diabetes mellitus and primary open-angle glaucoma in the course of a comorbid condition. J.ophthalmol.(Ukraine).2021;3:3-9. http://doi.org/10.31288/oftalmolzh2021339 Background: Diabetic retinopathy DR in type 2 diabetes mellitus (T2DM) and primary open-angle glaucoma (POAG) share some common pathogenetic mechanisms, raising the possibility that, in the course of a comorbid condition, the two diseases may exacerbate each other. Purpose: To use regression analysis in order to determine the predictors of the development of DR in T2DM and POAG in the course of a comorbid condition. Material and Methods: We examined 649 patients (649 eyes). These included 301 (301 eyes) with both DR and POAG; 164 (164 eyes) with DR but no POAG; 81 (81 eyes) with POAG but no T2DM; and 103 (103 eyes) having neither T2DM nor POAG (controls). Severity of DR was graded as per the 2002 guidelines of the American Academy of Ophthalmology. The stage of POAG was determined according to the classification of perimetric changes. Multivariate logistic regression analysis was used to develop models in Statistica 10 (GLZ; StatSoft, Tulsa, OK). Results: Blood glucose above 6.05 mmol/l, glycated hemoglobin above 6.1% and female gender were found to be independent predictors of the risk of developing DR. Patient age and the presence, stage and duration of POAG had no impact on the risk of developing DR. Duration of T2DM, elevated IOP and female gender were found to be positive predictors, whereas best-corrected visual acuity (BCVA), a negative predictor of the risk of developing POAG. Patient age, carbohydrate metabolic compensation indices and the stage of DR had no impact on the risk of developing POAG. A regression model was developed, allowing to predict the development of POAG with a total prediction accuracy of 85.7% (OR, 35.82; 95% CI, 22.92-56.00). The cut-off values of the predictors of developing POAG were a duration of T2DM above 3.5 years (accuracy, 60.2%), IOP above 23.2 mmHg (accuracy, 85.1%), and BCVA below 0.8 (accuracy, 70.3%). Conclusion: Blood glucose above 6.05 mmol/l, glycated hemoglobin above 6.1% and female gender were independent predictors of the risk of developing DR. Duration of T2DM and elevated IOP were predictors of the risk of developing POAG. Keywords: diabetic retinopathy, type 2 diabetes mellitus, primary open-angle glaucoma, predictors Сonflict of interest Statement. The authors declare no conflict of interest.
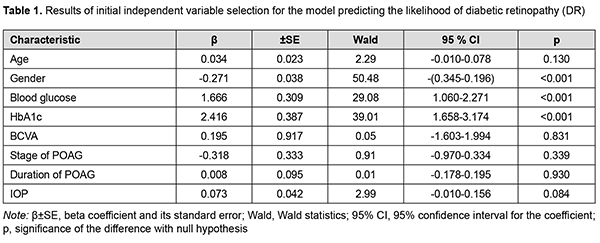
Introduction Diabetes mellitus is one of the fastest-growing health challenges of the 21st century, with the number of adults living with diabetes having more than tripled over the past 20 years [1]. In addition, according to the International Diabetes Federation Diabetes Atlas, 9th edition, 9.3% of adults aged 20–79 years – a staggering 463 million people – were living with diabetes in 2019. However, in 2010, worldwide diabetes prevalence was projected to reach 438 million by 2030, and this figure is already exceeded. Diabetic retinopathy (DR) is a common complication of T2DM [2]. In 2012, the estimated number of individuals world-wide with any DR was 93 million, and the global prevalence of DR, for the period 2015 to 2019, was 27.0% [3]. Retinal vascular changes which affect microcirculatory functions, contribute to hypoxia and cause damage to retinal photoreceptors are major components of the pathogenesis of DR in T2DM, and the major changes are related to nerve and endothelial cells as well as pericytes [4]. In 2013, the global prevalence of glaucoma for population aged 40-80 years was 3.54%, and the number of people (aged 40-80 years) with glaucoma worldwide was estimated to increase to 76.0 million in 2020 and 111.8 million in 2040 [5]. Primary open-angle glaucoma (POAG) is the most common type of glaucoma accounting for three-quarters of all glaucoma cases. Glaucomatous optic neuropathy (GON) is a major pathogenetic process involved in the production of clinical signs of the disease [6]. Intraocular pressure (IOP), ocular perfusion pressure, ocular blood flow, myopia, and central corneal thickness are considered to be among the major causative factors in POAG development. DR in T2DM and GON in POAG share some common pathogenetic mechanisms, raising the possibility that, in the course of a comorbid condition, the two diseases may exacerbate each other [6]. Diabetes is associated with an increased IOP, which has a role in the development of POAG in diabetics. It has been reported that the prevalence of POAG among type 2 diabetics was 15.6% [7], which was significantly higher than among general population [5]. Others have reported that the prevalence of POAG was five to six times higher in the diabetic population than in the general population [8]. In a Danish study [9], patients treated with DM drugs had about two times higher relative risk of glaucoma, when adjusting for a range of factors. A meta-analysis [10] found that diabetes increased the incidence of glaucoma by 36%. The duration of diabetes was found to be an independent predictor of glaucoma [7] and DR [11]. Therefore, results of clinical studies have confirmed that DR in T2DM and GON in POAG may exacerbate each other. The purpose of this study was to use regression analysis in order to determine the predictors of diabetic retinopathy development in patients having both type 2 diabetes mellitus and POAG. Material and Methods The study was conducted during 2016-2020. One thousand four hundred and fifty patients with T2DM (age, 45 to 75 years) were examined. These included 970 men (66.9%) and 480 women (33.1%). The duration of T2DM ranged from 2 to 15 years. A representative group of 649 patients (649 eyes) was formed for statistical analysis. This group included 301 patients (301 eyes) with both DR and POAG; 164 patients (164 eyes) with DR but no POAG; 81 patients (81 eyes) with POAG but no T2DM; and 103 patients (103 eyes) examined and treated for age-related cataract but having neither T2DM nor POAG (controls). Patients underwent a routine eye examination which included visual acuity, refractometry, tonometry, static automatic perimetry, biomicroscopy, gonioscopy, and ophthalmoscopy with Volk Super Field lens and Goldmann three-mirror lens (Volk Optical, Mentor, OH). Moreover, patients underwent spectral domain optical coherence tomography (SD-OCT; Copernicus REVO, Optopol Technology Sp, zo.o, Zawiercie, Poland; scan programs, Retina 3D and Retina Raster) and SD-OCT angiography (Copernicus REVO; scan programs, Retina Angio and Retina Angio Wide). Anterior raster scan was used to examine the anterior eye, if needed. The Follow up function was used to repeat all the relevant parameters of a previously required scan of the patient. The structure and reflectivity of retinal layers were assessed, and central subfield thickness (CST), macular thickness (CST), and macular volume (MV) measured. Parameters of the foveal avascular zone (FAZ), choroidal vascular flow area (VFA), and retinal nerve fiber layer (RNFL) were assessed. Neuroretinal rim area and volume, cup-to-disc area ratio, minimum cup depth, maximum cup depth, and asymmetry of horizontal and vertical cup-to-disc ratios were assessed. Patients underwent Disc Damage Likelihood Scale (DDLS) grading. If a fundus examination was needed, fundus photography was performed and in some cases included the ETDRS seven standard fields as per the modified ETDRS Airlie House classification [12]. Severity of DR was graded as per the 2002 guidelines of the American Academy of Ophthalmology [14]. Of the 465 eyes with T2DM, 107 were classified as category 1 (either no DR or mild non-proliferative DR), 205 as category 2 (moderate or severe non-proliferative DR), and 153 as category 3 (proliferative DR). Primary open-angle glaucoma was staged according to the staging scheme developed by Nesterov and Bunin (1976) (stage 1 or mild POAG; stage 2 or moderately advanced POAG; stage 3 POAG or far advanced disease; and stage 4 or terminal-stage POAG) and the classification of perimetric changes by stages of glaucoma [15]. Patients with normal tension POAG (NTG) were identified using IOP measurements. Blood glucose level was measured by the glucose oxidase method, and glycated hemoglobin (HbA1c), by the high performance liquid chromatography (HPLC) method. Multivariate logistic regression analysis was used to develop a model in Statistica 10 (GLZ; StatSoft, Tulsa, OK). Binomial variables were used to indicate whether DR was present or absent and whether POAG was present or absent. The presence or absence of DR (coded as 0 or 1, respectively) as well as the presence or absence of POAG (coded as 0 or 1, respectively) was used as a dependent variable. The variables obtained from clinical and laboratory tests and ophthalmoscopy and the variables indicating the stage of DR (based on the category value of 1, 2 or 3) and the stage of POAG (based on the POAG stage value) were used as independent variables. Maximum likelihood estimation with a stepwise exclusion of variables was applied to select predictors for a regression model. The interval’s method was used and Wald statistics, odds ratio (OR), 95% confidence interval (95% CI) and the P value for the difference with the null hypothesis calculated to assess the efficacy of predictors. After the non-fitting variables were eliminated initially, the models for calculating the likelihood of developing DR and POAG were developed with selected predictors. The obtained regression models were tested for correspondence between calculated values for the likelihood of developing DR or POAG and the actual data. Receiver operator characteristic (ROC) curves were constructed. The minus 2 log likelihood for the full model, area under curve (AUC) and Nagelkerke's pseudo-R2 measure of variance were used as model fitness criteria. Finally, classification characteristics of the model (sensitivity, specificity, accuracy, OR and 95% CI) for the cut-off likelihood of 0.5 were assessed. Results Table 1 presents the results of independent variable selection for the model predicting the development of DR.
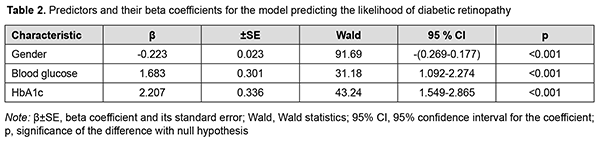
Blood Glucose and HbA1c were found to be the independent variables having a direct effect on the dependent variable, and thus were selected as effective predictors of the development of DR by backward regression. Also, Gender was associated with the likelihood of development of DR. The Gender variable was binomial (the male category was coded as 101, and the female category was coded as 102). Table 2 presents obtained regression coefficient values.
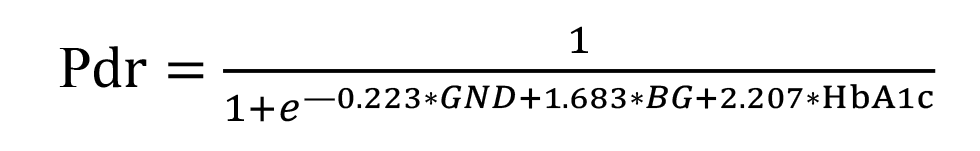
The regression equation for the developed model for predicting DR is given below.
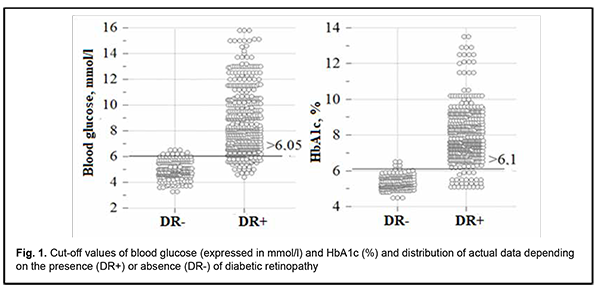
where Pdr is likelihood of developing DR; GND is index of the Gender category (with the male category coded as 101, and the female category coded as 102); BG is blood glucose expressed as mmol/l; HbA1c is glycated hemoglobin expressed as a percentage of total hemoglobin. Model fitness was demonstrated through the ROC analysis by strong associations between the predictors and the response variables: -2×log=169.5; R2=0.869; АUC=0.983 ± 0.004 (95% CI, 0.970-0.991). There was a significant difference between the null hypothesis and the alternative hypothesis (p < 0.001). Predictions of the development of DR using formula (1) have an accuracy of 94.4% for positive classification results, and 94.6% for negative classification results, with a total prediction accuracy of 94.5% (OR, 293.8; 95% CI, 138.7-622.1). The critical values of the predictors in the model predicting the likelihood of the development of DR were calculated with the help of an interactive module for analysis of ROC curves of univariate logistic regression models using MedCalc 18 software (MedCalc Software Ltd, Ostend, Belgium). The results are presented in Fig. 1.
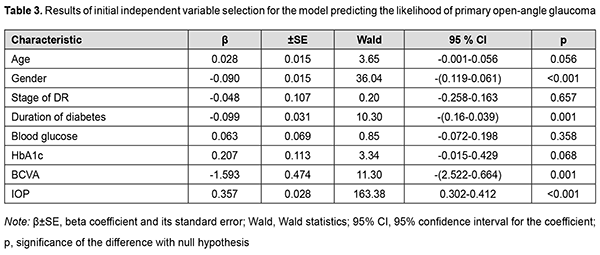
An increase in the probability of developing DR occurs with an increase in the predictors of the development of DR, blood glucose and HbA1c, above the calculated cut-off values, 6.05 mmol/l (sensitivity 90.3%; specificity 95.1%; accuracy 91.7%; OR, 48.03; 95% CI, 29.75-77.56) and 6.1% (sensitivity 94.2%; specificity 96.7%; accuracy 94.9%; OR, 481.26; 95%CI, 195.4-1185.6), respectively. We analyzed an amount of increase in the probability of the development of DR by men and women. The probability of the development of DR was lower for men than women (OR, 0.800; 95% CI, 0.76- 0.84; р < 0.001). Correspondingly, female gender was a risk factor for DR. Therefore, the probability of DR was directly proportional to carbohydrate metabolic compensation indices, blood glucose and HbA1c. Men had a lower risk of DR than women. In our study, age had no substantial effect on the development of DR. As the duration and stage of POAG had no effect on the probability of the development of DR, we may conclude that the presence of POAG had no effect on the risk of the development of DR in T2DM. Table 3 presents the results of the initial selection of independent variables for the model predicting the development of POAG.
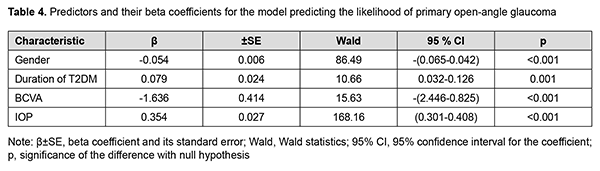
The regression analysis selected Gender, Duration of T2DM, BCVA and IOP as significant predictors of the development of POAG. Table 4 presents values of the regression coefficients for these predictors and their interval estimates.
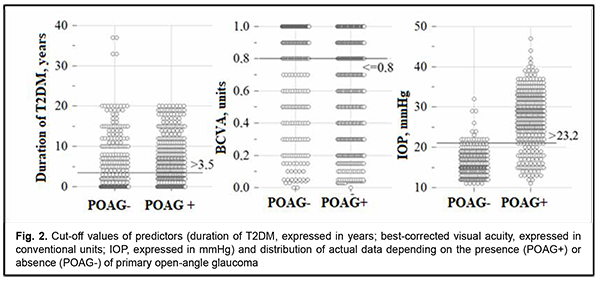
Therefore, the model predicting the development of POAG included the variables having direct (Duration of T2DM and IOP) and reverse (BCVA) effects on the dependent variable. The probability of POAG depended on the gender of the patient, as did the probability of DR. The regression equation for the developed model for predicting POAG is given below. where Pgl is likelihood of developing POAG; GND is index of the Gender category (with the male category coded as 101, and the female category coded as 102); DD is duration of T2DM expressed in years; BCVA is best-corrected visual acuity expressed in conventional units, and IOP is intraocular pressure expressed in mmHg. Model fitness was demonstrated through the ROC analysis, and performance measures of the model were satisfactory, with -2 × log = 436.3; R2 = 0.667; АUC = 0.922 ± 0.010 (95% CI, 0.898-0.941). There was a significant difference between the null hypothesis and the alternative hypothesis (p < 0.001). Predictions of the development of POAG using formula (2) have an accuracy of 85.6% for positive classification results, and 85.8% for negative classification results, with a total prediction accuracy of 85.7% (OR, 35.82; 95% CI, 22.92-56.0). The critical values of the predictors in the model predicting the likelihood of the development of POAG are presented in Fig. 2.
An increase in the probability of developing POAG occurs with an increase in the duration of diabetes above 3.5 years (sensitivity 60.5%; specificity 59.9%; accuracy 60.2%; OR, 2.28; 95% CI, 1.66-3.15) and IOP above 23.2 mmHg (sensitivity 76.4%; specificity 97.4%; accuracy 85.1%; OR, 14.43; 95% CI, 6.57-31.72), and with a decrease in BCVA below 0.8 (sensitivity 74.3%; specificity 64.4%; accuracy 70.3%; OR, 5.25; 95% CI, 3.73-7.37). The probability of the development of POAG was lower for men than women (OR, 0.95; 95% CI, 0.94-0.96; р < 0.001). Correspondingly, female gender was a risk factor for POAG as well as for DR. Therefore, the probability of developing POAG was directly associated with the duration of diabetes and IOP, and inversely associated with BCVA. Thus, the duration of diabetes had a positive effect on the development of POAG. Discussion It has been already reported previously [6] that DM may be associated with elevated IOP and thus affect the development of POAG. Current data regarding the direct relationship between DM and POAG, however, remain controversial [15]. We demonstrated that IOP is an independent risk factor for POAG, particularly, in the course of comorbid T2DM and POAG. In multivariate analysis for POAG (n=1840), associations have been found for age (OR, 1.04 per year; p = 0.048), IOP (OR, 1.19 per 1 mm Hg; p < 0.001), and history of diabetes treated with insulin (OR, 3.05; P = 0.045) [16]. In the current study, POAG was not associated with age (р = 0.056), but was strongly associated with an IOP above 23.2 mmHg (OR, 14.43; 95% CI, 6.57-31.72). We believe that a stronger association between POAG and IOP in our study was caused by the presence of comorbid T2DM and POAG. In addition, our study found not just an association between POAG and T2DM, as did a study by Topouzis and colleagues [16], but it found that the presence of T2DM longer than 3.5 years was a risk factor for POAG (OR, 2.28; 95% CI, 1.66-3.15). A national Italian survey [17] (2879 patients with POAG and 973 controls) found that mean IOP was significantly higher (p = 0.01) and myopia was more prevalent (p = 0.005) in the POAG group. The latter is an agreement with our finding of an association between POAG and BCVA worse than 0.8 (OR, 5.25; 95% CI, 3.73-7.37). In the pooled analysis comprising seven original studies no significant relationship between the prevalence of POAG and DM was identified (pooled OR = 1.37; 95% CI: 0.72–2.02) [6]. We believe that this finding can be explained by an overgeneralized approach that masked subtle relationships in the course of comorbid T2DM and POAG. Thus, the current study found that POAG was not a risk factor for DR since the stage of POAG, duration of POAG or IOP were not risk factors for DR in the course of comorbid T2DM and POAG. The presence of T2DM and duration of T2DM, however, were not risk factors for POAG. On the other hand, there is extensive evidence of increased risk of the development of POAG among patients with DM [10, 18, 19]. In a meta-analysis [10] incorporating seven prospective cohort studies, the pooled risk ratio of the association between POAG and diabetes based on the risk estimates of the seven cohort studies was 1.36 (95% CI = 1.24-1.50), with no significant heterogeneity across studies. A meta-analysis by Zhao and colleagues [18] identified 47 studies including 2 981 342 individuals from 16 countries, with the risk of glaucoma increasing by 5% for each year since diabetes diagnosis. In addition, the pooled average difference in IOP comparing patients with diabetes with those without diabetes was 0.18 mmHg (95% CI, 0.09-0.27). Moreover, it was concluded that diabetes, diabetes duration, and fasting glucose levels were associated with a significantly increased risk of glaucoma, and diabetes and fasting glucose levels were associated with slightly higher IOP. These findings are in agreement with ours. A meta-analysis [19] incorporating thirteen studies (seven case-control studies and six population-based cohort studies), the pooled relative risk of the association between DM and POAG based on the risk estimates of the six cohort studies was 1.40 (95% CI, 1.25–1.57). The pooled OR of the association between DM and POAG based on the risk estimates of the seven case-control studies was 1.49 (95% CI, 1.17–1.88). These findings also confirmed that individuals with DM have an increased risk of developing POAG. Therefore, it can be finally argued that T2DM contributes to the development of POAG. A hypothesis has been offered to explain the correlation between DM and POAG, suggesting that long-standing hyperglycemia and lipid dysregulation might increase the risk of neuronal stress damage [6]. A significant role has been established for hyperglycemia-mediated mitochondrial dysfunction which contributes to accelerated apoptosis of retinal ganglion cells and their axons [20]. In addition, epithelial dysfunction contributes to the development of vascular disorders in DR [21], which may condition the progression of GON. Vascular endothelial cell dysfunction and loss of retinal pericytes have been described in diabetic retinopathy and are associated with hypoxia [22]. Hyperglycemia-induced impairment in the remodeling of the connective tissue of the optic nerve head and regulation of the trabecular meshwork and lamina cribrosa with elevated IOP as well as increased mechanical load on the optic nerve head play an important role in the onset of POAG [23]. The anatomical and functional status of the vessels can influence the structure and function of the optic nerve. Additionally, metabolic disturbances of the carbohydrate metabolism could play a role in glaucoma damage and pathogenesis [4, 6]. Conclusion Blood glucose and glycated hemoglobin as well as female gender were found to be independent positive predictors of the risk of developing DR. Patient age and the presence, stage and duration of POAG had no impact on the risk of developing DR. A regression model was developed, allowing to predict the development of DR with a total prediction accuracy of 94.5% (OR, 293.8; 95% CI, 138.7-622.1). The cut-off values of the predictors of developing DR were a blood glucose level above 6.05 mmol/l (accuracy 91.7%) and an HbA1c level of 6.1% (accuracy 94.9%). Duration of T2DM, IOP and female gender were found to be positive predictors, whereas BCVA was found to be a negative predictor of the risk of developing POAG. Patient age, carbohydrate metabolic compensation indices and the stage of DR had no impact on the risk of developing POAG. A regression model was developed, allowing to predict the development of POAG with a total prediction accuracy of 85.7% (OR, 35.82; 95% CI, 22.92-56.00). The cut-off values of the predictors of developing POAG were a duration of T2DM above 3.5 years (accuracy, 60.2%), IOP above 23.2 mmHg (accuracy, 85.1%), and BCVA below 0.8 (accuracy, 70.3%). References 1.International Diabetes Federation. IDF Diabetes Atlas, 9th Edition [Internet]. Brussels, Belgium: International Diabetes Federation, 2019 [cited 2021 March 05]. Available from: https://www.diabetesatlas.org/en/. 2.Cheloni R, Gandolfi SA, Signorelli C, Odone A. Global prevalence of diabetic retinopathy: protocol for a systematic review and meta-analysis. BMJ Open. 2019 Mar 3; 9(3):e022188. 3.Thomas RL, Halim S, Gurudas S, Sivaprasad S, Owens DR. IDF Diabetes Atlas: A review of studies utilising retinal photography on the global prevalence of diabetes related retinopathy between 2015 and 2018. Diabetes Res Clin Pract. 2019 Nov; 157:107840. 4.Eshaq RS, Aldalati AMZ, Alexander JS, Harris NR. Diabetic retinopathy: Breaking the barrier. Pathophysiology. 2017 Dec; 24(4):229-241. 5.Tham YC, Li X, Wong TY, Quigley HA, Aung T, Cheng CY. Global prevalence of glaucoma and projections of glaucoma burden through 2040: a systematic review and meta-analysis. Ophthalmology. 2014 Nov; 121(11):2081-90. 6.Grzybowski A, Och M, Kanclerz P, Leffler C, Moraes CG. Primary Open Angle Glaucoma and Vascular Risk Factors: A Review of Population Based Studies from 1990 to 2019. J Clin Med. 2020 Mar 11; 9(3):761. 7.Dharmadhikari S, Lohiya K, Chelkar V, Kalyani VKS, Dole K, Deshpande M, et al. Magnitude and determinants of glaucoma in type II diabetics: A hospital based cross-sectional study in Maharashtra, India. Oman J Ophthalmol. 2015 Jan-Apr; 8(1):19-23. 8.Thakuria J, Deka DC, Sarma S. Prevalence of glaucoma amongst diabetic patients attending a tertiary health care in North Eastern India. IJHRMLP. 2017 Jan;3(1):96-101. 9.Horwitz A, Petrovski BÉ, Torp-Pedersen C, Kolko M. Danish Nationwide Data Reveal a Link between Diabetes Mellitus, Diabetic Retinopathy, and Glaucoma. J Diabetes Res. 2016; 2016:2684674. 10.Zhao YX, Chen XW. Diabetes and risk of glaucoma: systematic review and a Meta-analysis of prospective cohort studies. Int J Ophthalmol. 2017; 10(9): 1430-5. 11.Voigt M, Schmidt S, Lehmann T, Köhler B, Kloos C, Voigt UA, Meller D, Wolf G, Müller UA, Müller N. Prevalence and Progression Rate of Diabetic Retinopathy in Type 2 Diabetes Patients in Correlation with the Duration of Diabetes. Exp Clin Endocrinol Diabetes. 2018 Sep; 126(9):570-6. 12.Early Treatment Diabetic Retinopathy Study Research Group. Grading diabetic retinopathy from stereoscopic color fundus photographs – an extension of the modified Airlie house classification: ETDRS report № 10. Ophthalmology. 2020 Apr; 127(4S): 99-119. 13.Balashevich LI, Izmailov AS. [Diabetic ophthalmopathy]. Saint Petersburg: Chelovek; 2012. Russian. 14.Nesterov AP. [Glaucoma]. Moscow: Meditsinskoie informatsionnoie agenstvo; 2014. Russian. 15.Yanagi M, Kawasaki R, Wang JJ, Wong TY, Crowston J, Kiuchi Y. Vascular risk factors in glaucoma: a review. Clin Exp Ophthalmol. 2011 Apr; 39(3):252-8. 16.Topouzis F, Wilson MR, Harris A, Founti P, Yu F, Anastasopoulos E, et al. Risk factors for primary open-angle glaucoma and pseudoexfoliative glaucoma in the Thessaloniki eye study. Am J Ophthalmol. 2011 Aug; 152(2):219-228.e1. 17.Orzalesi N, Rossetti L, Omboni S; OPTIME Study Group (Osservatorio sulla Patologia glaucomatosa, Indagine Medico Epidemiologica); CONPROSO (Collegio Nazionale dei Professori Ordinari di Scienze Oftalmologiche). Vascular risk factors in glaucoma: the results of a national survey. Graefes Arch Clin Exp Ophthalmol. 2007 Jun; 245(6):795-802. 18.Zhao D, Cho J, Kim MH, Friedman DS, Guallar E. Diabetes, fasting glucose, and the risk of glaucoma: a meta-analysis. Ophthalmology. 2015 Jan; 122(1):72-8. 19.Zhou M, Wang W, Huang W, Zhang X. Diabetes mellitus as a risk factor for open-angle glaucoma: a systematic review and meta-analysis. PLoS One. 2014 Aug 19; 9(8):e102972. 20.Kong GY, Van Bergen NJ, Trounce IA, Crowston JG. Mitochondrial dysfunction and glaucoma. J Glaucoma. 2009 Feb; 18(2):93-100. 21.Mogilevskyy SYu, Panchenko IuO, Ziablitsev SV. New risk factors for post-surgical recurrent diabetic maculopathy in type 2 diabetes mellitus. J Oftalmol (Ukraine). 2019; (5):9-17. 22.Song BJ, Aiello LP, Pasquale LR. Presence and Risk Factors for Glaucoma in Patients with Diabetes. Curr Diab Rep. 2016 Dec; 16(12):124. 23.Roberts MD, Grau V, Grimm J, Reynaud J, Bellezza AJ, Burgoyne CF, Downs JC. Remodeling of the connective tissue microarchitecture of the lamina cribrosa in early experimental glaucoma. Invest Ophthalmol Vis Sci. 2009 Feb; 50(2):681-90.
|
 (1),
(1),