J.ophthalmol.(Ukraine).2021;1:32-37.
|
http://doi.org/10.31288/oftalmolzh202113237 Received: 10 July 2020; Published on-line: 12 February 2021
OCTA-based retinal microvascular bed assessment at the zones ranging from the fovea to the periphery N. S. Lutsenko1, T. S. Kyrylova1, O. A. Rudycheva1, O. A. Isakova1, T. V. Nedilka2 1 Zaporizhzhya Medical Academy of Postgraduate Education; Zaporizhzhia (Ukraine) 2 Zaporizhzhia Regional Clinical Hospital; Zaporizhzhia (Ukraine) E-mail: tetianakyrylova@gmail.com TO CITE THIS ARTICLE: Lutsenko NS, Kyrylova TS, Rudycheva OA, Isakova OA, Nedilka TV. OCTA-based retinal microvascular bed assessment at the zones ranging from the fovea to the periphery. J.ophthalmol.(Ukraine).2021;1:32-7. http://doi.org/10.31288/oftalmolzh202113237 Background: Studies (particularly, optical coherence tomography angiography (OCTA) studies) on the peripheral microvascular bed in health are important because many retinal disorders involve its injury. Purpose: To improve the efficacy of diagnosing the changes in the retinal microvascular bed through its OCTA-based assessment at the zones ranging from the fovea to the periphery in normal eyes. Material and Methods: Fourteen healthy individuals were included in the study. Three sequential 3 mm x 3 mm OCTA scans with displacement from the center of the fovea to the periphery for each of the three directions (superior, inferior and temporal directions) were registered. Results: Superficial plexus vessel density and deep plexus vessel density were assessed at 1-9 mm from the center of the fovea. We found that superficial plexus vessel density progressively increased (38-46%) with distance from the center of the fovea, whereas deep plexus vessel density moderately decreased (18-25%) with distance from the center. Superficial plexus vessel density was significantly increased in the superior and inferior directions at the zones with the presence of vascular arcades, and these arcades are absent in the temporal direction; this makes the temporal direction most reliable and promising for studies on microcirculation at the ocular periphery. Conclusion: OCTA is an effective technique for assessing the retinal microvascular bed at the zones ranging from the fovea to the far periphery. Keywords: optical coherence tomography angiography, retinal vessel density, deep capillary plexus, periphery
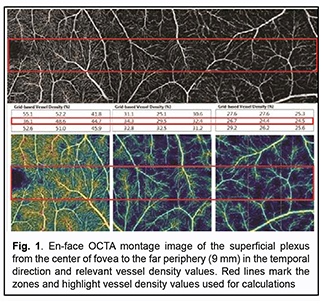
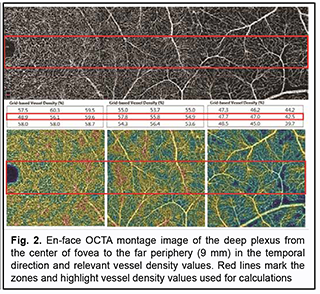
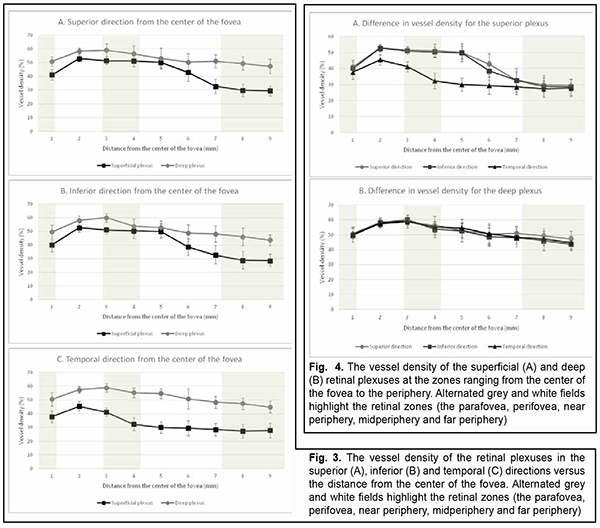
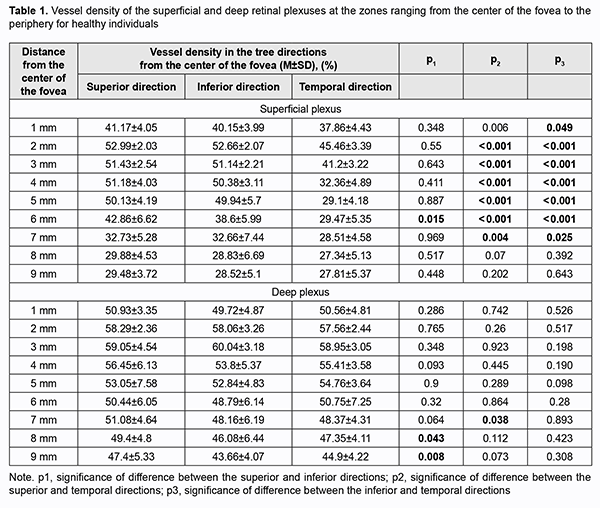
Introduction Optical coherence tomography angiography (OCTA) has become a routine study in the evaluation of patients with a retinal disease characterized by changes in the retinal microvascular bed. It is a well-established noninvasive retinal vascular imaging technique which may be applied at multiple time points and is especially advantageous because it provides 3-D imaging [1]. As opposed to multimodal vascular imaging techniques that use dyes, OCTA does not enable assessing the permeability of walls of normal or newly formed vessels; OCTA images, however, are not obscured by dye leakage, enabling a more accurate assessment of the borders and area of nonperfusion or neovascular regions [2, 3, 4]. Recent studies have reported that OCTA was comparable to fluorescence angiography (FA), and even more effective in assessing pathological retinal changes in retinal vascular disorders [5, 6]. The high-resolution in the axial direction has allowed the various layers of the retinal microcirculation to be selectively evaluated by OCTA, which was consistent with known histology [7, 8, 9]. The capacity of OCTA devices for providing highresolution imaging and effective detection and removal of artifacts and continuous advances in technology have enabled expansion of the retinal scanning area and assessment of the retinal microvascular bed beyond the macular area, making OCTA a major diagnostic technique for evaluation of retinal vascular disorders such as such as diabetic retinopathy or retinal vessel occlusion [6, 10, 11]. On some swept source (SS)-OCTA devices, widefield scan patterns are available, such as 12 mm x 12 mm. However, studies have demonstrated that resolution and segmentation of such scans are subadequate for reliable assessment of retinal plexuses [12, 13]. Therefore, it is important to develop an adequate methodology for OCTA scanning of the peripheral retina and measuring characteristics of the retinal microvascular bed in these zones in normal eyes. The purpose of the study was to improve the efficacy of diagnosing the changes in the retinal microvascular bed through its OCTA-based assessment at the zones ranging from the fovea to the periphery in normal eyes. Material and Methods Fourteen healthy individuals (28 eyes; 9 women and 5 men) were included in the study. Subject mean age was 41.8 ± 12.1 years (range, 25 – 61). Inclusion criteria were age of 20-80 years, absence of history or evidence of eye disease (excluding a correctable refractive error of -3.0 D to +2.0 D), and absence of a systemic disease (such as essential hypertension, diabetes mellitus, etc.) that may affect the retinal microvascular bed. Eyes were excluded if the OCTA image quality score was <7 (according to the OCT manufacturer) due to the presence of significant eye motion artifacts or significant ocular media opacity. The software assigns a scan quality measure to each image, ranging from 1 to 10, and taking into account signal strength, image sharpness and presence of motion artifacts. This study was approved by the local ethics committee. Written informed consent was obtained from all participants before enrollment and the conduct of the study adhered to the Declaration of Helsinki. The AngioVue OCTA system (RTVue XR OCT Avanti, Optovue, Inc., Fremont, CA) was used for splitspectrum amplitude-decorrelation angiography (SSADA) measurements with OCT. Studies were performed under dark room conditions and no mydriatic agent was used during the image acquisition. The AngioRetina 3 × 3 mm scan protocol was used to obtain high-resolution retinal scans and avoid motion artifacts and segmentation. Imaging was performed using eye tracking function (DualTrac™) of the device. DualTrac Motion Correction Technology combines realtime tracking, a high-speed infrared camera, and patented post-processing to enable true 3D correction of distortion in all directions. If automated segmentation errors were present, they were manually corrected. OCTA scans were displaced superiorly, inferiorly or temporally from the center of the fovea. Nasal OCA scans were excluded from the study because the optic nerve was located in this sector. Nine scans were obtained for each subject. The number of scans for each direction was selected on the basis of human retinal regions as defined by Polyak [14]. The radius of the outer boundary is distance from the fovea: foveola, 175 μm radius; foveal floor, 200 μm radius; parafovea, 1250 μm radius; perifovea, 2750 μm radius; near periphery, 4250 μm radius; midperiphery, 7250 μm radius, and far periphery (beyond 7250 μm). Therefore, we decided to encompass a zone with a size not more than 9 mm from the center to have all the above retinal regions involved within this zone. Three sequential 3 × 3 mm scans were registered through manual displacement of the scan region in the three directions, with the displacement guided by boundaries of real-time en face view of a 3 mm × 3 mm OCT preview scan. Given a concave curvature of the fundus and because OCTA software can scan a limited field of view (with a diameter of 12 mm), we used artificial displacement of the point of fixation to enable alignment of peripheral retinal sites with respect to the scanner and to capture an area having a size as large as 12 mm from the center of the fovea. For this purpose, each subject was asked to fixate not on the fixation target but on the marginal dot of the red field, with this dot located at a relevant direction. The retinal zones located beyond 9 mm from the center of the fovea were not included in the study due to failure to determine a clear fixation point for adequate alignment of the retinal profile, this failure resulting in poor image quality and motion artifacts. Correction of focus, axial length and polarization was performed for every OCT scanning site with an increase in site distance from the fovea. Retinal vascular perfusion density analysis was performed using the proprietary AngioAnalytics (Optovue) vessel density algorithm. OCTA-based vessel density assessment was performed separately for the superficial and deep plexuses. For this purpose, Density option and the report of parameters for the complete image were used, with a 3 × 3 mm scan area automatically divided into nine measurement quadrants of 1 × 1 mm each. The data for the three central quadrants for each OCTA scan made in the direction from the fovea to the periphery (horizontal quadrants for the scans made for the temporal direction from the center of the fovea and vertical quadrants for the scans made in the superior and inferior directions from the center) was taken in account for calculations. Figs. 1 and 2 exemplify montage OCTA images and quantitative vascular density analysis for the superficial and deep plexuses for the temporal direction. Statistical analyses were conducted using Statistica 10.0 (StatSoft, Tulsa, OK, USA) software. The Student t test was used to assess statistical significance. The level of significance p ≤ 0.05 was assumed. Data are presented as mean ± standard deviation (SD). Results Table 1 and Figs. 3 and 4 present the results of vascular density assessment for the superficial and deep plexuses for the directions from the center of the fovea to the superior, inferior and temporal periphery of the retina. There were characteristic regional variations in retinal plexus density (Figs. 3 and 4). The retinal vascular density in the superficial and deep plexuses tended to increase as the transition was made from the center of the fovea to the perifovea, and to gradually decrease as the transition was made from the perifovea to the periphery. The superficial plexus vessel density was the greatest at 2 mm from the center of the fovea (i.e., at the perifovea), and equaled 52.99 ± 2.03%, 52.66 ± 2.07% and 45.46 ± 3.39%, for the superior, inferior and temporal directions, respectively. In addition, retinal vascular density gradually decreased as the transition was made from the perifovea to midperifery (2 mm to 5 mm from the center of the fovea), and abruptly decreased at the far periphery (8 mm from the center), for the superior and inferior directions. Conversely, for the temporal direction, the superficial plexus vessel density abruptly decreased as the transition was made from the center of the fovea to the interface of the near and far retinal periphery (4 mm from the center), and practically did notchange with a subsequent transition to the far periphery (9 mm from the center). There was a significant difference (р < 0.05) in the superficial plexus vessel density between the temporal direction and superior or inferior direction for the range of 1-7 mm from the center of the fovea. The deep plexus vessel density was the greatest at the interface of the perifovea and near retinal periphery (3 mm from the center of the fovea), and equaled 59.05±4.54%, 60.04 ± 3.18% and 58.95 ± 3.05%, for the superior, inferior and temporal directions, respectively. The profile of vessel density dependence of the distance from the center of the fovea was flat, with a tendency to drop, for all the three directions. A significant difference in vessel density was found only between the superior and inferior directions (p < 0.05) at 8-9 mm from the center of the fovea, with the vessel density for the former direction being higher than for the latter direction. The superficial plexus vessel density was higher than the deep plexus vessel density for any direction (р = 0.02 and р = 0.03 at 5 mm from the center of the fovea for the superior and inferior directions, respectively, and р < 0.001 at any other zone for the three directions). We calculated a percentage increase in vessel density at the parafovea (1 mm from the center of the fovea), perifovea (2 mm from the center), near periphery (4 mm from the center), midperiphery (6 mm from the center) and far periphery (9 mm from the center) separately for the superficial plexus and deep plexus for better understanding of the tendencies of changes in vessel density with increase of the distance from the center of the fovea. Thus, superficial plexus vessel density increased 28.7%, 31.2 % and 20.1% (р < 0.001) at the perifovea compared with the parafovea for the superior, inferior and temporal directions, respectively. In addition, compared with the perifovea, superficial plexus vessel density decreased 3.4% at the near periphery (р=0.039), 19.1% at the midperiphery (р < 0.001) and 44.4% at the far periphery (р < 0.001) for the superior direction. A similar tendency was observed for the inferior direction, and the characteristic decreased 4.3% (р = 0.002), 26.7% (р < 0.001) and 45.8% (р < 0.001) at the near periphery, midperiphery and 44.4% and far periphery. Moreover, compared with the perifovea, superficial plexus vessel density decreased 9.4%, 35.2% and 38.82% (р < 0.001) at the near periphery, midperiphery and far periphery, respectively, for the superior direction. We found a lower magnitude of changes in vessel density with distance from the center of the fovea in the deep plexus than in the superficial plexus. Thus, deep plexus vessel density increased 14.5%, 16.7 % and 13.8% (р < 0.001) at the perifovea compared with the parafovea for the superior, inferior and temporal directions, respectively. In addition, at the near periphery, deep plexus vessel density decreased 3.2% (р = 0.145), 7.3% (р < 0.001) and 3.7% (р = 0.013) for the superior, inferior and temporal directions, respectively, compared with the perifovea. Moreover, for the superior, inferior and temporal directions, deep plexus vessel density decreased 13.5%, 16% and 11.8%, respectively, (р < 0.001) at the midperiphery, and 18.6%, 24.8%, and 22%, respectively, (р < 0.001) at the far periphery, compared with the perifovea. Discussion In the current study, we performed OCTA-based assessment of retinal vascular plexus density at various zones from the center of the fovea to the far periphery for the three directions. The methodology described in Material and Methods enabled more precise data registration and obtaining scans of improved quality, compared to other methods of registration of OCTA images of peripheral retinal sites [6, 13, 15]. We found that superficial plexus vessel density progressively increased (38-46%) with an increase in the distance from the center of the fovea from 2 mm to 9 mm, whereas deep plexus vessel density was more stable and moderately decreased (18-25%) with an increase in the distance from the center of the fovea from 3 mm to 8 mm. Such changes are likely to be associated with the anatomical structure of the peripheral retina. It has been reported that the main structural differences between the central and peripheral retina were related to the relative thicknesses of the inner plexiform layer, ganglion cell layer and retinal nerve fiber layer (i.e., the layers where the superficial plexus is located). The layers where the deep plexus layer is located (the inner nuclear layer and outer plexiform layer), however, do not undergo substantial changes in thickness with distance from the center of the fovea [14, 16, 17]. Others reported also on deep vascular plexus involvement in oxygenation of the photoreceptor cell layers [18, 19]. Given that, normally, the photoreceptor cell layer and the outer nuclear layer have relatively the same thickness at the peripheral retina as at the central retina [14, 16, 17], it may be assumed that the absence of significant variations in deep plexus vessel density with distance from the center of the fovea results from the requirement for blood supply, particularly that to these retinal layers. A significant difference in superficial deep plexus vessel density at 4-7 mm from the fovea between the superior or inferior direction versus temporal direction is likely to be explained by the fact that scanning areas for the superior and inferior directions include, particularly (but not only), large vessels of the superior and inferior retinal vascular arcades and their branches, which results in significantly increased vessel density characteristics. Some OCTA studies of retinal sites with the presence of vascular arcades and optic disc used image processing algorithms for removing particular vessels from the image by masking (i.e., converting white pixels to black pixels) [9, 20]. We believe that this approach is not reasonable because it does not solve the problem of miscalculation of superficial plexus vessel density, but results in underestimation of characteristics. In addition, this approach makes the plexus density calculation process too complicated for routine clinical practice. The absence of retinal vascular trunks in the temporal direction makes studies in this sector most reliable and promising for quantification of retinal microcirculation in health and disease. The current study has several limitations. First, the study sample was small, and further research with larger sample sizes (including not only healthy subjects, but also patients) is warranted. A small sample size does not allow assessing the relationships of the retinal microcirculation characteristics with age, gender and refraction. However, in an OCTA study with a larger sample by Fujiwara and colleagues [21], the retinal region of interest was the center of the fovea (a 3.0 × 3.0 mm area), and they found that age, gender, refractive error, and axial length were not significantly correlated with foveal avascular zone area. Examination of the above relationships warrants further study. Second, we cannot exclude the possibility of error in our assessment of plexus densities for various distances from the center of the fovea, because the displacement of a 3.0 × 3.0 mm scanning area in any of the three directions was performed manually, which could cause scan positioning errors. We, however, did our best to make the displacement guided by boundaries of real-time en face view of a 3 mm × 3 mm OCT preview scan. Therefore, OCTA is an effective technique for assessing the retinal microvascular bed not only at the macular area, but also at the periphery of the retina, and enables separate quantification of superficial and deep plexus characteristics, which is an advantage compared to other available imaging techniques. In the current study on normal eyes, we assessed vessel density of the retinal plexuses at distances ranging 1 to 9 mm from the center of the fovea (i.e., zones from the fovea up to the far retinal periphery), for the three directions. We found that superficial plexus vessel density progressively increased (38-46%) with distance from the center of the fovea (р < 0.001), whereas deep plexus vessel density was more stable and moderately decreased (18-25%) with distance from the center (р < 0.001). The presence of retinal vascular trunks at the midperiphery in the superior and inferior directions from the fovea and the impossibility to correct the assessment of vessel density for these zones make the temporal direction most reliable and promising for studies on the microvascular bed at the ocular periphery.
References 1.Tong S, Li H, Wang L, Tudi, M. Concentration, Spatial Distribution, Contamination Degree and Human Health Risk Assessment of Heavy Metals in Urban Soils across China between 2003 and 2019 - A Systematic Review. Int J Environ Res Public Health. 2020 Apr 29;17(9):3099. 2.Tytła M. Assessment of Heavy Metal Pollution and Potential Ecological Risk in Sewage Sludge from Municipal Wastewater Treatment Plant Located in the Most Industrialized Region in Poland-Case Study. Int J Environ Res Public Health. 2019 Jul 9;16(13):2430. 3.Stetsenko DO, Dolin VV. [Heavy metals in soils of radiocontaminated forest environmental systems]. Poshukova ta ekologichna geokhimiia. 2009;9:42-7. Ukrainian. 4.Biletska EM, Onul NM, Golovkova TA, et al. [Environment- and hygiene-based determinacy of deterioration of health for population of industrial region]. 2016;4:14-8. Ukrainian. 5.Rahman Z, Singh VP. The relative impact of toxic heavy metals (THMs) (arsenic (As), cadmium (Cd), chromium (Cr(VI)), mercury (Hg), and lead (Pb)) on the total environment: an overview. Environ Monit Assess. 2019 Jun 8;191(7):419. 6.Junaid M, Hashmi MZ, Malik RN, et al. Toxicity and oxidative stress induced by chromium in workers exposed from different occupational settings around the globe: A review. Environ Sci Pollut Res Int. 2016 Oct;23(20):20151-20167. 7.World’s Worst Pollution Problems 2015. Available at:https://www.greencross.ch/wp-content/uploads/uploads/media/pollution_rep... 8.Vasyuta VA. [Medical and social substantiation of the system of medical care for patients with optic nerve atrophy]. [Extended Abstract of Dissertation for the Degree of Dr Sc (Med)]. Kyiv, 2015. Ukrainian. 9.Vennam S, Georgoulas S, Khawaja A, et al. Heavy metal toxicity and the aetiology of glaucoma. Eye (Lond). 2020 Jan; 34(1):129-37. 10.Lin S-C, Singh K, Lin SC. Association Between Body Levels of Trace Metals and Glaucoma Prevalence. JAMA Ophthalmol. 2015 Oct;133(10):1144-50. 11.Jung SJ, Lee SH. Association between Three Heavy Metals and Dry Eye Disease in Korean Adults: Results of the Korean National Health and Nutrition Examination Survey. Korean J Ophthalmol. 2019 Feb;33(1):26-35. 12.Wills NK, Kalariya N, Sadagopa Ramanujam VM, et al.. Human retinal cadmium accumulation as a factor in the etiology of age-related macular degeneration. Exp Eye Res. 2009; 89: 79-87. 13.Apel W, Stark D, Stark A, et al. Cobalt-chromium toxic retinopathy case study. J Doc Ophthalmol. 2013 Feb;126(1):69–78. 14.Ng SK, Ebneter A, Gilhotra JS. Hip-implant related chorio-retinal cobalt toxicity. Indian J Ophthalmol. Jan-Feb 2013;61(1):35-7. 15.Garcia MD, Hur M, Chen JJ, et al. Cobalt toxic optic neuropathy and retinopathy: Case report and review of the literature. Am J Ophthalmol Case Rep. 2020 Jan 25;17:100606. 16.Vashkulat NP. Establish levels of heavy metals in soils in Ukraine. Environ Health. 2002;2:44–6. 17.Enterosgel reference data: https://compendium.com.ua/info/45247/enterosgel_/?gclid=Cj0KCQiAhs79BRD0... 18.Rybolovlev IuR, Rybolovlev RS. [Dosing substances for mammals based on biological activity constants]. Doklady Akademii Nauk SSSR. 1979;247(6):1513-6. Russian. 19.Salama A, Hegazy R, Hassan A. Intranasal Chromium Induces Acute Brain and Lung Injuries in Rats: Assessment of Different Potential Hazardous Effects of Environmental and Occupational Exposure to Chromium and Introduction of a Novel Pharmacological and Toxicological Animal Model. PLoS One. 2016; 11(12): e0168688. 20.Duckett S. Abnormal deposits of chromium in the pathological human brain. J Neurol Neurosurg Psychiatry. 1986 Mar; 49(3): 296–301. 21.Fang Z, Zhao M, Zhen H, et al. Genotoxicity of tri- and hexavalent chromium compounds in vivo and their modes of action on DNA damage in vitro. PLoS One. 2014 Aug 11;9(8):e103194. 22.Xiao F, Li Y, Dai L, et al. Hexavalent chromium targets mitochondrial respiratory chain complex I to induce reactive oxygen species-dependent caspase-3 activation in L-02 hepatocytes. Int J Mol Med. 2012 Sep;30(3):629-35. 23.Sun H, Brocato J, Costa M. Oral Chromium Exposure and Toxicity. Curr Environ Health Rep. 2015 Sep;2(3):295-303. 24.Velichkovskiĭ BT. Vestn Ross Akad Med Nauk. 2001;(6):45-52. [Free radical oxidation as a link of early and prolonged adaptation to environmental factors]. Russian. 25.Kurutas EB. The importance of antioxidants which play the role in cellular response against oxidative/nitrosative stress: current state. Nutr J. 2016 Jul 25;15(1):71. 26.Kotyzová D, Hodková A, Bludovská M, et al. Effect of chromium (VI) exposure on antioxidant defense status and trace element homeostasis in acute experiment in rat. Toxicol Ind Health. 2015 Nov;31(11):1044-50. 27.Patlolla AK, Barnes C, Yedjou C, et al. Oxidative stress, DNA damage, and antioxidant enzyme activity induced by hexavalent chromium in Sprague-Dawley rats. Environ Toxicol. 2009;24(1):66-73. 28.Mary Momo CM, Ferdinand N, Omer Bebe NK, et al. Oxidative Effects of Potassium Dichromate on Biochemical, Hematological Characteristics, and Hormonal Levels in Rabbit Doe (Oryctolagus cuniculus). Vet Sci. 2019 Mar;6(1):30. 29.Bucio L, García C, Souza V. Uptake, cellular distribution and DNA damage produced by mercuric chloride in a human fetal hepatic cell line. Mutat Res. 1999 Jan 25;423(1-2):65-72. 30.Castellino N, Aloj S. Intracellular distribution of lead in the liver and kidney of the rat. Br J Ind Med. 1969 Apr;26(2):139-43. 31.Hertz L, Dienel GA. Lactate transport and transporters: general principles and functional roles in brain cells. J Neurosci Res. 2005 Jan 1-15;79(1-2):11-8. 32.Maiuolo J, Macrì R, Bava I, et al. Myelin Disturbances Produced by Sub-Toxic Concentration of Heavy Metals: The Role of Oligodendrocyte Dysfunction. Int J Mol Sci. 2019 Sep 14;20(18):4554. 33.Chin-Chan M, Navarro-Yepes J, Quintanilla-Vega B. Environmental pollutants as risk factors for neurodegenerative disorders: Alzheimer and Parkinson diseases. Front Cell Neurosci. 2015 Apr 10;9:124. 34.Nikolaiev VG, Klishch IM, Zhulkevich IV. [Using Enterosgel for prevention of oxidative stress in acute blood loss]. Visnyk naukovykh doslidzhen. 2009;8:72-4. Ukrainian. 35.Howell CA, Mikhalovsky SV, Markaryan EN, et al. Investigation of the adsorption capacity of the enterosorbent Enterosgel for a range of bacterial toxins, bile acids and pharmaceutical drugs. Sci Rep. 2019;9:5629.
The authors declare no conflict of interest which could influence their opinions on the subject or the materials presented in the manuscript.
|