J.ophthalmol.(Ukraine).2019;6:7-14.
|
http://doi.org/10.31288/oftalmolzh20196714 Received: 07 November 2019; Published on-line: 31 December 2019 PPAR?-mediated differences in energy substrate among T2DM patients differing in the stage of diabetic retinopathy S.O. Rykov,1 Dr Sc (Med), Prof; L.V. Natrus,2 Dr Sc (Med), Prof; M.Iu. Bykhovets,1 Post-graduate Student 1 Shupik National Medical Academy of Postgraduate Education; Kyiv (Ukraine) 2 Bohomolets National Medical University; Kyiv (Ukraine) E-mail: Lnatrus777@gmail.com Background: Because fatty acid binding proteins (FABPs) and peroxisome proliferator-activated receptor (PPAR) ? physically interact, the ability of FABPs to modulate lipid signaling could be exploited for developing medications, improving therapeutic or prophylactic measures for the control of metabolic disorders, and for controlling the activity of their therapeutic targets such as PPARs. Purpose: To examine PPAR?-mediated differences in energy substrate among type 2 diabetes mellitus (T2DM) patients differing in the stage of diabetic retinopathy. Material and Methods: This study involved 101 T2DM patients (101 eyes) with different stages of diabetic retinopathy (DR) and 40 non-diabetics (controls) who were comparable in age, gender and body mass index. DR was graded using the ETDRS scale. The polymorphism was detected by real-time PCR on a Real-Time Gene Amp® PCR System 7500 (Applied Biosystems). ELISA was used to determine serum L-FABP levels with Human L-FABP ELISA kit (Hycult Biotech). Conclusion: We found a significant variation in fatty acid (FA) concentrations in red blood cell membranes in T2DM patients differing in PPAR?-gene mediated phenotypes. Among wild-type carriers, arachidonic acid concentration increased 1.4-fold in those with the early stage of DR (р < 0.05) compared to controls and decreased 7.5-fold in those with DR progression (р < 0.05). Among carriers of the 12Ala allele, arachidonic acid concentration decreased twofold in those with the early stage of DR (р < 0.05) compared to controls, and further gradually decreased with DR progression. There was a gradual and not significant increase in L-FABP concentration with DR progression in T2DM patients carrying the wild genotype. Among carriers of the 12Ala allele, concentration of the chaperone increased fourfold in those with the early stage of DR compared to controls (р < 0.05), and gradually decreased with DR progression. Keywords: diabetic retinopathy, type 2 diabetes mellitus, L-FABP, fatty acids, RBC membrane, lipid metabolism
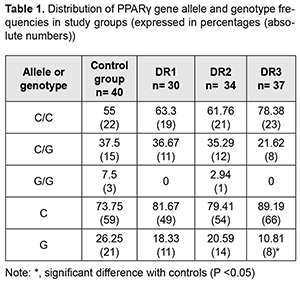
Introduction Diabetic retinopathy (DR) is the leading cause of blindness among working-age adults around the world [1, 2]. This, coupled with the predicted increase in the prevalence of type 2 diabetes mellitus (T2DM), makes DR a serious and prevalent vision-threatening disease. Data from recent clinical trials demonstrate that dyslipidemia is an important, but often overlooked factor in the development of DR [3]. Patients with diabetic dyslipidemia have been found to have a high incidence of retinal damage [4]. However, unlike macrovascular complications, where direct correlation between pathology and circulating lipid levels is well established [5], the role of circulating lipids in microvascular complications is still controversial and intensively studied. Compared with controls at four years, type 2 diabetes mellitus (T2DM) patients that were administered fenofibrate for elevated triglycerides, or simvastatin for elevated cholesterol demonstrated reduced progression of DR [6]. Synthetic peroxisome proliferator-activated receptor ? (PPAR?) ligands like thiazolidinediones (TZDs) are used to treat T2DM; they, however, not only contribute to insulin sensitization, but also promote fat accretion, with yet unknown long-term effects [7]. In addition, the mechanism of the TZDs, and causes of their ambiguous efficacy and sometimes effects differing in different cases, are still to be elucidated [8,9]. PPARs are ligand-activated transcription factors and belong to a nuclear hormone receptor family. They have been shown to control genes of key enzymes involved in lipid and carbohydrate metabolism and to provide a link between external environmental factors and internal mechanisms of energy homeostasis. PPAR? has gained interest as a therapeutic target in the diseases in which dyslipidemia is pathogenetically involved, such as metabolic syndrome (MS), T2DM, obesity, and etc [9-11]. The impact of PPAR gene polymorphisms on phenotypic traits of energy metabolism has been intensively studied recently. The partial loss-of-function Pro12Ala mutation in the PPAR?2-speci?c B exon has been found to be associated with a lower body mass index (BMI), greater insulin sensitivity, and an improved lipid pro?le [12, 13]. In contrast to the hypomorphic Pro12Ala allele, the rare Pro115Gln substitution renders PPAR? constitutively active, and carriers of this mutation are extremely obese and insulin resistant [14]. Similar to PPARs, fatty acid binding proteins (FABPs) access the nucleus under certain conditions and also target fatty acids (FA) to transcription factors [9]. As lipid chaperones, FABPs protect cells from excessive fatty acid levels [15], and may actively facilitate the transport of lipids to specific compartments in the cell, such as to the lipid droplet for storage; to the endoplasmic reticulum for signaling, trafficking and membrane synthesis; to the mitochondria or peroxisome for oxidation; to the nucleus for lipid-mediated transcriptional regulation; or even outside the cell to signal in an autocrine or paracrine manner [16]. Under the unnaturally excessive and continuous caloric intake, decreased energy expenditure, and the distinctly stressful lifestyle of contemporary humans, FABPs may not be sufficient to maintain metabolic homeostasis, and hence no longer be beneficial. In this scenario, their presence now facilitates the formation of obesity, diabetes, dyslipidaemia, atherosclerosis and inappropriate immune responses [17,18,19]. Liver FABP (L-FABP) and PPAR physically interact, and therefore it has been suggested that L-FABP could be considered a co-activator in PPAR-mediated gene regulation. Therefore, the ability of FABPs to modulate lipid signalling and trafficking could be exploited for developing medications, improving therapeutic or prophylactic measures for the control of metabolic disorders, and for controlling the activity of nuclear hormone receptors as therapeutic targets [9, 20]. The association between L-FABP expression and the PPAR? gene polymorphism, remains, however, unclear. Clarifying this matter will be of importance to determine the features of impairments in lipid metabolism and pave the way for correction of these impairments. The purpose of this study was to examine PPAR?-mediated differences in energy substrate among T2DM patients differing in the stage of diabetic retinopathy. Material and Methods This study involved 101 T2DM patients (101 eyes) in whom their eye examinations found different stages of DR. They underwent an eye examination including visual acuity assessment, refractometry, static Humphrey perimetry, tonometry, and biomicroscopy. In addition, gonioscopy, ophthalmoscopy with a Goldmann contact lens, and macular optical coherence tomography (Topcon DRI OCT Triton, Tokyo, Japan) were performed, when required. Fundus photography (the ETDRS seven standard fields) was performed with the fundus camera TRC-NW7SF (Topcon, Tokyo, Japan). Fluorescein angiography was performed when indicated. Diabetic retinopathy was graded using ETDRS scale. The patients were divided into three groups based on the stage of DR: group DR1 included 30 patients (30 eyes) with mild, moderate or severe non-proliferative DR (NPDR), group DR2 comprised 34 patients (34 eyes) with mild, moderate or severe proliferative DR (PDR), and group DR3 comprised 37 patients (37 eyes) with progressive PDR. All patients had their thyroid hormone levels measured to exclude the presence of hormonal abnormalities. The control group comprised 40 non-diabetics without diagnosed metabolic abnormalities who had their medical check-up at the Clinical Diagnostic Laboratory of the Bohomolets National Medical University (NMU). All biochemical, molecular genetic and gas-liquid chromatography studies were performed at the certified laboratories of the Bohomolets NMU Research Institute for Experimental and Clinical Medicine. The biochemical measurements were performed using biochemical assay kits from Diagnosicum Zrt (Hungary) and a semiautomatic biochemistry analyzer from Sinnowa Medical Science and Technology Co. Ltd (Nanjing, Jiangsu, China; Model: BS3000M ). ELISA was used to determine serum L-FABP levels with Human L-FABP ELISA kit (Hycult Biotech, Uben, the Netherlands). Gas-liquid chromatography was used to determine fatty acid composition of red blood cell (RBC) membranes following extraction of red blood cell mass from venous blood. We have identified the nine most informative fatty acids (denoted as 100%), and calculated relative abundance for (a) each of these, (b) the combination of saturated fatty acids (SFA; myristic C14:0, pentadecanoic (C15:0), palmitic (C16:0), and stearic (C15:0)), (с) the combination of unsaturated fatty acids (USFA; oleic (C18:1), linoleic (C18:2), linolenic (C18:3) and arachidonic (C20:4)), and the combination of essential polyunsaturated fatty acids (PUFA; C18:2, C18:3 and C20:4). Venipuncture whole blood samples were collected using 2.5-mL collection tubes containing ethylenediaminetetraacetic acid and were used for molecular genetic studies. After collection, tubes were frozen at -20 °C. Genomic DNA was extracted according to the manufacturer’s instructions (PureLink® Genomic DNA Kits Invitrogen, USA). Briefly, blood cells were incubated in digestion buffer with proteinase K to lyse the membrane and pellet the DNA, and an additional incubation was performed with RNAse to prevent contamination. Mutation detection was performed using TaqMan Mutation Detection Assays (Thermo Fisher Scientific) in a Real-Time PCR System 7500 (Applied Biosystems, USA). The rs1801282 polymorphism of the PPARG gene is located on chromosome 3 (Chr. 3:12393125 as per NCBI Build 37). The context sequence information was as follows: AACTCTGGGAGATTCTCCTATTGAC[C/G]CAGAAAGCGATTCCTTCACTGATAC. The rs1801282 in the PPAR-gamma is characterized by a C-to-G substitution encoding a proline to alanine substitution at codon 12. The C allele is a considered a wild allele, whereas the G allele is considered a minor allele with its frequency index of 0.0703/352 according to MAF Source: 1000 Genomes (http://www.1000genomes.org/node/506). The material under study was incubated in the presence of DNA polymerase with primers flanking the DNA regions of interest in the Gene Amp® PCR System 7500 (Applied Biosystems, USA). Data were analysed using IBM SPSS version 23 and MedStat software. Normality of quantitative data was established using the Shapiro–Wilk test. Most parameters were not normally distributed. Consequently, non-parametric statistical tests were used for statistical analyses at a significance level of 0.05. The descriptive statistical indices of median, and 25th and 75th percentile [Q1-Q3] for the groups are listed in tables. 95% confidence intervals for median and interquartile ranges were calculated. Bar charts are provided with 95% confidence intervals (CI). Kruskal-Wallis test was used for comparisons between groups. The Dunn’s test or the Mann-Whitney test with Bonferroni correction was used for pairwise comparisons. Results and Discussion There have been numerous epidemiological studies on the frequencies of the heterozygous and homozygous polymorphisms of the PPARG gene within various populations and on their associations with metabolic disorders [19]. There were 18 carriers (45%) of the 12Ala allele in the control group; of these, 3 were (7.5%) homozygous carriers of the allele. In addition, there were 33 carriers (33%) of the 12Ala allele among diabetics; of these, only one (1%) was a minor homozygote. Previous studies by others [21, 22] reported that populations of Ukrainian patients with metabolic disorders carried predominantly the wild Pro12Pro genotype, and even suggested a protective role of the 12Ala allele in the development of DM and MS. In the current study, compared to the controls (Table 1), the percentage of carriers of the PPARG gene polymorphism was also decreased in all DR groups, but significantly only in group DR3.
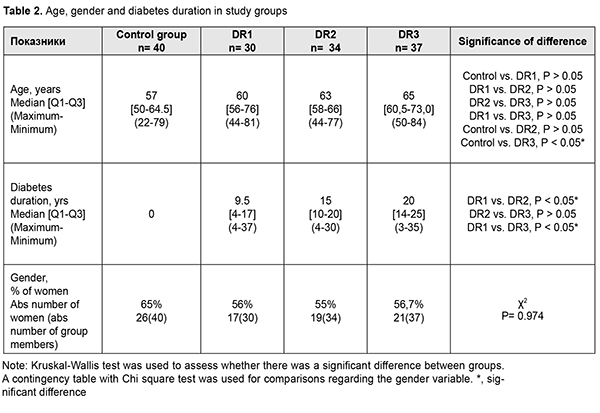
We compared our patients with T2DM and non-diabetic controls regarding age, gender, mass, and BMI to investigate the factors that may influence the development of T2DM and the progression of DR (Table 2). Because 3 individuals in the control group were under the age of 30, there was a significant difference in age between patients of DR3 group and controls. Severity levels of DR (ETDRS severity scale) were correlated with the duration of diabetes (r = 0.401, р < 0.01). The percentage of women was lower in all DR groups compared to the controls, but not significantly. No expected significant difference in BMI was observed between controls and T2DM patients with different stages of DR. In addition, there was not an increase, but a gradual decrease in BMI from 29.3 kg/m2 [37.2-32.3] in the DR1 group with an increase in the stage of DR. Although the controls also had high BMI values, we did not use BMI ?25 kg/m2 as an exclusion criterion for a more reliable comparison of effects on metabolism.
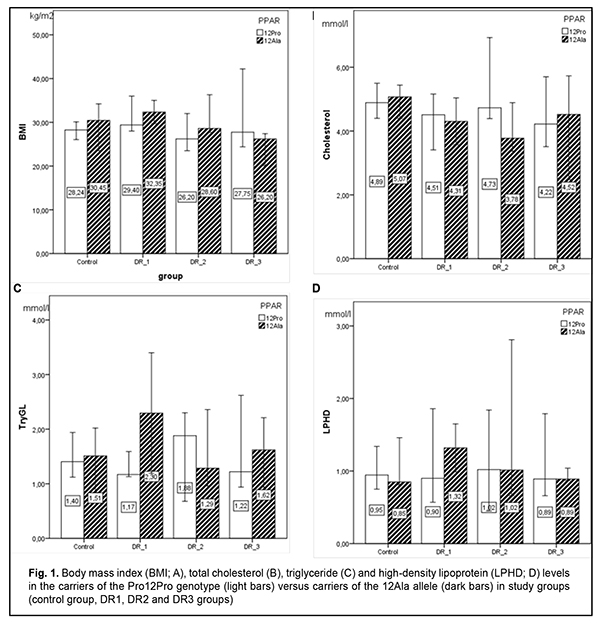
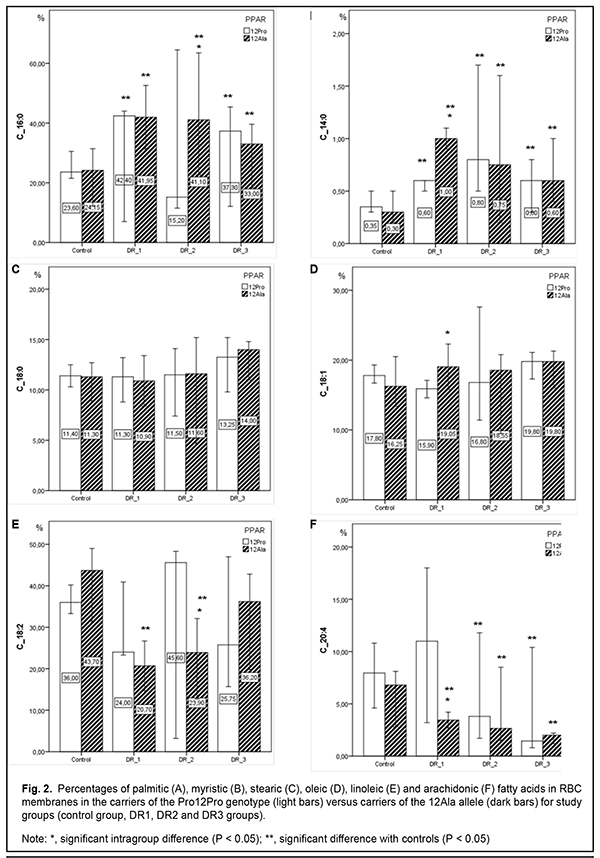
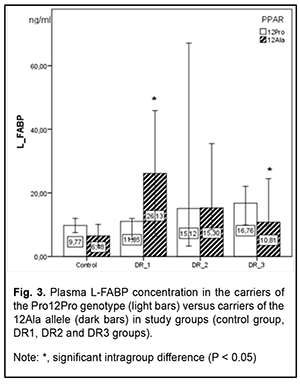
In patients of the DR1 and DR2 groups and controls, 12Ala allele carriers had higher BMI values, although differences were not significant. However, in the DR3 group, 12Ala allele carriers had lower BMI values. There are contradictions in the literature regarding this issue. Kaydashev and colleagues [21] found evidence of increased BMI in carriers of this polymorphism, whereas others [13] suggested a protective effect of the 12Ala allele against obesity. PPARG-mediated analysis showed no significant difference in lipid profile characteristics between groups with different stages of DR. Previously, we have already noted no significant difference in lipid profile characteristics between groups with different stages of DR; however, taking genetic heterogeneity into account, we did find some differences in these characteristics between carriers of the polymorphism and wide-type subjects. In the current study, we exemplified only three lipid profile characteristics. Compared to wild-type subjects, serum total cholesterol levels in polymorphism carriers were lower for the DR1 and DR2 groups, and higher for the DR3 group and controls. Interestingly, 12Ala allele carriers had higher levels of triglycerides and high-density lipoproteins compared to wild-type carriers, but only for the DR1 group, and the difference was not significant. It is believed that it is reasonable to analyze the fatty acid (FA) composition in the body through the analysis of FA concentrations in red blood cell (RBC) membranes since an RBC membrane is an established biological model of membranes of most cells in the body [20, 23]. Previously, we have analyzed concentrations of the nine particularly informative fatty acids in RBC membranes in groups of patients with different stages of DR against healthy controls. That analysis demonstrated a substantial and significant relative increase in saturated fatty acids (SFAs) with an increase in the stage of DR, indicating a pathological process, since accumulation of SFAs in the cell, especially, in the cell membrane, results in substantial changes in cell properties, plasticity, capacity for endocytosis, reactivity to ligand acceptance, and lateral movement of receptor rafts and integral proteins, leading to a reduced response to cytokines and reduced cell-to-cell interaction. In the DR1 and DR3 groups, SFAs were 1.5-fold to two-fold more abundant (p < 0.05) than unsaturated fatty acids (USFAs) at the expense of polyunsaturated fatty acids. In the DR2 group, the SFAs were practically as abundant as the USFAs. There was a tendency toward a decrease in myristic and arachidonic acid concentrations and increase in stearic and oleic acid concentrations with DR progression. Our analysis of FA concentrations in RBC membranes in individuals with different PPARG-gene mediated phenotypes demonstrated a number of differences between patients with DR and healthy controls (Fig. 2). In the control group, there was practically no difference in FA concentrations among individuals differing in genotype. However, regarding USFAs, there was a tendency (р > 0.05) toward increased linoleic acid concentrations and decreased oleic and arachidonic acid concentrations for 12Ala allele carriers. As opposed to controls, the abundance of minor SFAs (myristic (C14:0), pentadecanoic (C15:0), and margaric (C17:0) acids) was significantly increased in patients (maximally, in the DR1 group, and minimally, in the DR3 group); however, a persistent increase was characteristic only of the polymorphism carriers. In the DR1 group, minor SFAs in 12Ala allele carriers were 2.6-fold and threefold more abundant than in carriers of the wild-type Pro12Pro genotype (р < 0.05) and controls (р < 0.05), respectively. In the DR2 group, palmitic acid in 12Ala allele carriers was 2.7-fold more abundant than in carriers of the wild-type Pro12Pro genotype (р < 0.05), but there was no substantial difference in stearic acid abundance between the former and latter carriers. Variation in oleic acid (C18:1) abundance was characteristic of only of DR patient carriers of the Pro12Pro genotype, with the least abundance found for the DR1 group, and the most, for the DR3 group. In addition, oleic acid concentration in carriers of the polymorphism was consistently elevated irrespective of the development of diabetic complication. A substantial variation in linoleic acid (C18:2) concentration was noted, especially among wild-type carriers. Concentration of C18:2 FA in the DR1 and DR3 groups was lower, whereas in the DR2 group, higher than in controls. In the DR2 group, there was a twofold difference (р < 0.05) in linoleic FA concentration between wild-type and polymorphism carriers. Among 12Ala carriers, linoleic FA concentration gradually increased from the DR1 to the DR3 group. A significant variation in arachidonic acid concentration was noted. Previously, we have observed a relative decrease in C20:4 FA with DR progression. However, in the current study, among wild-type carriers, total arachidonic acid concentration increased 1.4-fold in the DR1 group (р < 0.05), decreased twofold in the DR2 group (р < 0.05), and decreased 5.6-fold in the DR3 group (р < 0.05), compared to the controls. In addition, for polymorphism carriers, there was a consistent trend toward a relative decrease in C20:4 FA with DR progression, although this difference was less significant than that for wild-type carriers. Previously, we have found a significantly elevated serum L-FABP level in patients with long duration of diabetes with DR. In the current study, L-FABP concentration increased 1.5-fold (р < 0.05), 1.3-fold, and 1.7-fold in the DR1, DR2 and DR3 groups, respectively, compared to controls. We believe that a reduced L-FABP expression in the DR2 group compared to the DR1 group reflects the body’s adaptation to high levels of plasma fatty acids, and has a hampering effect on DR development and progression. Our examination of the relationship between L-FABP concentration and PPARG genotype (Fig. 3) showed a gradual and not significant increase in L-FABP concentration with DR progression in T2DM patients carrying the wild genotype. And, on the contrary, after a four-fold increased L-FABP level (р < 0.05) at the onset of DR, a gradual decrease in L-FABP level with DR progression, but without reaching the values of the control group, was found in T2DM patients carrying the 12Ala allele. In the control group, polymorphism carriers had lower L-FABP concentration (р < 0.05) compared to wild genotype carriers. Therefore, we found substantial differences in concentrations of fatty acids (a major energy substrate in the body) in cell membranes, and L-FABP (an important intercellular lipid chaperone) between patients with different PPARG gene-mediated phenotypes and different DR stages. This reflects the factors influencing the development of metabolic disorders, particularly, T2DM, and genetically determined susceptibility to the development of microvascular diabetic complications. Cock et al [7] reviewed a wide range of studies on PPAR? expression, including molecular and cellular studies, mouse genetic studies and human genetic studies, and concluded that (1) PPAR? is not only the master regulator of adipogenesis in vivo, but also a driving force of glucose and lipid homeostasis, and (2) moderate levels of PPAR? activation coordinate an important adaptive response [24], leading to efficient energy conservation and lipid storage in the adipocyte [7]. However, this evolutionarily maintained mechanism has been proved to be beneficial only under conditions of infrequent high caloric intakes and long periods of food shortages, which forced our progenitors to search for food throughout their life. Our present affluent style—characterized by a high caloric intake and a lack of physical exercise—now turns this once favorable energy conservation response into a detrimental one, which promotes dyslipidemia and related disorders like obesity, metabolic syndrome, and T2DM [17, 18]. Studies on characteristics of PPAR will offer the opportunity to utilize this mechanism for developing advanced therapeutic effects for the treatment of metabolic disorders, since full PPAR? agonists such as the TZDs, improve insulin sensitivity, glucose tolerance and the lipid profile in T2DM patients. Whereas enhanced PPAR? activity is invariably associated with increased fat mass, suboptimal PPAR? activation or PPAR? antagonism is neutral or even reverses weight gain. However, unlike the relationship between PPAR? and fat mass, PPAR? activity is not linearly related to insulin sensitivity, as both inactivation and activation of PPAR? can enhance insulin sensitivity [7]. This nonlinear relationship indicates that insulin sensitivity is an integrated effect, which is achieved predominantly by modulating PPAR? actions in the adipose tissue with effects on adipokine secretion and lipid storage, in addition to other tissue-specific PPAR? responses.
Conclusion First, we found a significant variation in FA concentrations in RBC membranes in T2DM patients differing in PPARG-gene mediated phenotypes. Among wild-type carriers, arachidonic acid concentration increased 1.4-fold in those with the early stage of DR compared to controls (р < 0.05), and decreased 7.5-fold in those with DR progression (р < 0.05). Among carriers of the 12Ala allele, arachidonic acid concentration decreased twofold in those with the early stage of DR compared to controls (р < 0.05), and further gradually decreased with DR progression. Second, there was a gradual and not significant increase in L-FABP concentration with DR progression in T2DM patients carrying the wild genotype. Among carriers of the 12Ala allele, concentration of the chaperone increased fourfold at the onset of DR compared to controls (р < 0.05), and gradually decreased with DR progression. Finally, when developing therapeutic treatments with PPAR? agonists and antagonists and lipotropic medications targeted at the transport of lipids across plasma, one should take into account specific PPAR?-mediated metabolic characteristics that identify genetically determined mechanisms of abnormal lipid metabolism and metabolic complications.
References 1.Balashevich LI, Izmailov AS. [Diabetic ophthalmopathy]. St. Petersburg: Chelovek; 2012. Russian. 2.Pasyechnikova NV. [Diabetic maculopathy: current aspects of the pathogenesis, clinical manifestations, diagnosis and treatment]. Kyiv: Karbon LTD; 2010. Russian. 3.Hammer SS, Busik JV. The role of dyslipidemia in diabetic retinopathy. Vision Res. 2017 Oct; 139: 228–36. 4.Sacks FM, Hermans MP, Fioretto P, et al. Association between plasma triglycerides and high-density lipoprotein cholesterol and microvascular kidney disease and retinopathy in type 2 diabetes mellitus: a global case-control study in 13 countries. Circulation. 2014 Mar 4;129(9):999-1008. 5.Persistent Effects of Intensive Glycemic Control on Retinopathy in Type 2 Diabetes in the Action to Control Cardiovascular Risk in Diabetes (ACCORD) Follow-On Study. Action to Control Cardiovascular Risk in Diabetes Follow-On (ACCORDION) Eye Study Group and the Action to Control Cardiovascular Risk in Diabetes Follow-On (ACCORDION) Study Group. Diabetes Care. 2016 Jul;39(7):1089-100. 6.Shiomi Y, Yamauchi T, Iwabu M, et al. A Novel Peroxisome Proliferator-activated Receptor (PPAR)? Agonist and PPAR? Antagonist, Z-551, Ameliorates High-fat Diet-induced Obesity and Metabolic Disorders in Mice. J Biol Chem. 2015 Jun 5;290(23):14567-81. 7.Cock T-A, Houten SM, Auwerx J. Peroxisome proliferator-activated receptor-?: too much of a good thing causes harm. EMBO Rep. 2004 Feb; 5(2): 142–7. 8.Saremi L, Lotfipanah S, Mohammadi M, et al. The Pro12Ala polymorphism in the PPAR?2 gene is not associated with an increased risk of NAFLD in Iranian patients with type 2 diabetes mellitus. Cell Mol Biol Lett. 2019; 24:12. 9.Grimaldi PA. Peroxisome proliferator-activated receptors as sensors of fatty acids and derivatives. Cell Mol Life Sci. 2007 Oct;64(19-20):2459-64. 10.Lee YK, Park JE, Lee M, Hardwicka J.P. Hepatic lipid homeostasis by peroxisome proliferator-activated receptor gamma 2. Liver Res. 2018 Dec; 2(4): 209–15. 11.Ma X, Wang D, Zhao W, and Xu L. Deciphering the Roles of PPAR? in Adipocytes via Dynamic Change of Transcription Complex. Front Endocrinol (Lausanne). 2018; 9: 473. 12.Deeb SS, Fajas L, Nemoto M, et al. A Pro12Ala substitution in the human PPAR?2 is associated with decreased receptor activity, improved insulin sensitivity, and lowered body mass index. Nat Genet. 1998 Nov;20(3):284-7. 13.Altshuler D, Hirschhorn JN, Klannemark M, et al. The common PPAR? Pro12Ala polymorphism is associated with decreased risk of type 2 diabetes. Nat Genet. 2000 Sep;26(1):76-80. 14.Hu E, Kim JB, Sarraf P, Spiegelman BM. Inhibition of adipogenesis through MAP-kinase mediated phosphorylation of PPAR?. Science. 1996 Dec 20;274(5295):2100-3. 15.Esteves A, Ehrlich R. Invertebrate intracellular fatty acid binding proteins. Comp Biochem Physiol C Toxicol Pharmacol. 2006 Mar-Apr;142(3-4):262-74. 16.Choroma?ska B, My?liwiec P, Dadan J, Hady HR, Chabowski A. The clinical significance of fatty acid binding proteins. Postepy Hig Med Dosw (Online).2011 Nov 24;65:759-63. 17.Boden G, Laakso M. Lipids and Glucose in Type 2 Diabetes. What is the cause and effect? Diabetes Care. 2004 Sep;27(9): 2253-9. 18.Rykov SO, Bykhovets MY, Natrus LV. [Features of the lifestyle as a risk factor for the development and progression of diabetic retinopathy in patients with type 2 diabetes mellitus]. Arkhiv Oftal'mologii Ukrainy. 2019. 7(1), 54-61. Ukrainian. 19.Rykov SO, Bykhovets MY, Natrus LV. [The role of metabolic disorders and genotype in the diabetic retinopathy development (review)]. Arkhiv Oftal'mologii Ukrainy. 2018. 6(3), 54-60. doi: http://dx.doi.org/10.22141/2309-8147.6.3.2018.165211. Ukrainian. 20.Furuhashi M, Hotamisligil GS. Fatty acid-binding proteins: role in metabolic diseases and potential as drug targets. Nat Rev Drug Discov. 2008 Jun;7(6):489-503. 21.Kaydashev IP, Rasin AM, Shlykova OA, et al. Frequency of the Pro12Ala-polymorphism of the gene PPAR?2 in the Ukrainian population and its possible relation to the development of the metabolic syndrome. Cytol Genet. 2007; 41(5):43-7. 22.Ziablytsev SV, Mokrii VI. [Association of the 12Pro allele of PPAR?2 (rs1801282) and type 2 diabetes mellitus]. Klinichna endocrynologiia i endocrinna khirurgiia. 2016;55(3):34-8. Ukrainian. 23.Petrenko OV, Natrus LV, Tavartkiladze К. [Concentrations of fatty acids in blood cells of patients with diabetic retinopathy]. Arkhiv Oftal'mologii Ukrainy. 2017;3(19): 54-60. Ukrainian. 24.Auwerx J. PPARgamma, the ultimate thrifty gene. Diabetologia. 1999 Sep;42(9):1033-49. The authors certify that they have no conflicts of interest in the subject matter or materials discussed in this manuscript.
|