J.ophthalmol.(Ukraine).2019;3:3-8.
|
http://doi.org/10.31288/oftalmolzh2019338 Received: 18 March 2019; Published on-line: 27 June 2019 Predicting the risk of diabetic retinopathy-associated macular edema in patients with type 2 diabetes mellitus S.Yu. Mogilevskyy1, Dr Sc (Med), Prof.; Iu.O. Panchenko3, Cand Sc (Med); S.V. Ziablitsev2, Dr Sc (Med), Prof 1 Shupik National Medical Academy of Postgraduate Education; Kyiv (Ukraine) 2 Bohomolets National Medical University; Kyiv (Ukraine) 3 Kyiv Municipal Clinical Hospital “Eye Microsurgery Center”; Kyiv (Ukraine) E-mail: sergey.mogilevskyy@gmail.com TO CITE THIS ARTICLE: Mogilevskyy SYu, Panchenko IuO, Ziablitsev SV. Predicting the risk of diabetic retinopathy-associated macular edema in patients with type 2 diabetes mellitus. J.ophthalmol.(Ukraine).2019;3:3-8. http://doi.org/10.31288/oftalmolzh2019338 Background: Previously, we have reported on the value of prothrombotic platelet phenotype as a factor for the development of diabetic maculopathy (DMP) and diabetic macular edema (DME) in patients with diabetic retinopathy (DR) and type 2 diabetes mellitus (DM2). Purpose: To predict DR-associated DME in patients with DM2 based on platelet dysfunction analysis. Materials and Methods: Ninety patients (92 eyes) with DM2 were included in the study. Of these eyes, 18, 43 and 31 were found to have, respectively, mild non-proliferative DR (NPDR), moderate or severe NPDR, and proliferative DR. Platelet aggregation agonists, adenosine diphosphate (ADP), platelet activation factor (PAF), and collagen (Sigma, St. Louis, MO), were used, and platelet aggregation was assessed with a Chrono-Log aggregometer. Methods for building logistic regression and neural network models were used to identify a set of independent variables associated with the risk for DME. Results: The risk for DME increased with increases in adrenaline- and PAF-induced platelet aggregations (p=0.03 and p=0.02, respectively) and decreased with an increase in collagen-induced platelet aggregation (p=0.046). There was a tendency to increase in the risk for DME with a one per cent increase in angiotensin II (ANG II)-induced platelet aggregation. Neural network analysis revealed non-linear associations of this risk with three independent variables, ANG II-, PAF-, and collagen-induced platelet aggregations. A neural network model with a sensitivity of 77.1% and specificity of 78.1% was created to predict DME based on this set of independent variables. Keywords: diabetic macular edema, type 2 diabetes mellitus, platelet dysfunction, prediction models
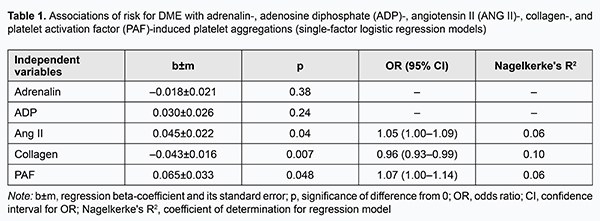
Introduction Diabetic retinopathy (DR) with potential diabetic maculopathy (DMP) is a major cause of visual disability in type 2 diabetes mellitus (DM2). Visual function loss frequently occurs due to diabetic macular edema (DME) [1-5]. The incidence of DME is estimated to be 2.3/100 person-years for the overall diabetic population and 4.5 for patients on insulin therapy [5]. In addition, the incidence of DME correlates with the severity of diabetes, but DME is more common in DM2 versus DM1 [1, 5]. Moreover, the prevalence of progression to DME increases to 28% if the duration of the disease exceeds 20 years [5]. Patients with non-proliferative DR (NPDR), pre-proliferative DR, and proliferative DR (PDR) have a prevalence of DME of 3-38%, 20-63%, and above 70%, respectively [4]. Although numerous studies have been conducted on retinal injury in diabetes, risk factors for DR and DMP, and identification of the most effective medication, vitreoretinal surgery and laser treatment approaches, the incidence of sight loss due to DM2 has been increasing steadily [6, 7]. Previously, we have reported on impaired platelet aggregation as a factor for the development of DMP and DME in patients with DR and DM2: the prothrombotic platelet phenotype was found in patients with DR [8, 9]. We believe that correct diagnosing and predicting disease progression and complications based on development of models describing the time course of disease is promising. Thus, we have demonstrated the prognostic value of models incorporating determination of polymorphisms in glutathione S-transferase and TP53 genes for predicting the onset and progression of primary open angle glaucoma [10, 11]. The purpose of the study was to predict DR-associated ME in patients with DM2 based on platelet dysfunction analysis. Materials and Methods Ninety patients (92 eyes) with DM2 were included in the study. Of these eyes, 18, 43 and 31 were found to have, respectively, mild NPDR, moderate or severe NPDR, and PDR. DMP was identified by the presence of specific diabetic retinal changes in the macula (microaneurysm, hemorrhages, intraretinal microvascular abnormalities, solid exudates, ischemia, and detachment of the posterior hyaloids membrane) and DME [1]. Severity of DR and DMP was graded as per the 2002 guidelines of the American Academy of Ophthalmology. Informed consent was obtained from all participants. Study design and protocol were approved by the Bioethics Committee. Patients underwent an eye examination which included visual acuity assessment, static Humphrey perimetry, refractometry, slit lamp biomicroscopy, gonioscopy, ophthalmoscopy with Volk Super Field lens and Goldmann three-mirror lens (Volk Optical, Mentor, OH) and fundus photography (the ETDRS seven standard fields) with the fundus camera TRC-NW7SF (Topcon, Tokyo, Japan). In addition, they underwent spectral domain optical coherence tomography (SD-OCT; Copernicus REVO, Optopol Technology Sp, zo.o, Zawiercie, Poland; scan programs, 3D and Raster) and SD-OCT angiography (Copernicus REVO). Fluoresecent angiography (FA) was performed with the fundus camera if (a) mild vitreoretinal neovascularization was suspected but not identified with ophthalmoscopy or fundus photography or (b) the visual function did not correspond either to ophthalmoscopic changes in the macula or OCT findings. Platelets were isolated by centrifugation of patient’s citrated peripheral blood and used to assess the functional activity of receptors. We used the following agonists involved in the pathogenesis of DM2: adenosine diphosphate (ADP) which reflects the level of activation of purin receptors P2Y1 and P2Y12; adrenaline, a humoral factor, whose level increases under conditions of stress response; angiotensin II (ANG II), a humoral factor, whose level increases following activation of the renin-angiotensin system; platelet activation factor (PAF), a paracrine mediator that ensures both platelet stimulation and platelet- white blood cell interaction in inflammation; and collagen, which reflects the effect of extracellular matrix remodeling. The agonists were obtained from Sigma (St. Louis, MO) and used in EC50 concentrations (adrenaline, 2.5±0.1 μm; collagen, 1.0±0.03 μg/mL; ANG II, 1.0±0.06 μm; PAF, 75.0±2.6 μm and ADP, 2.5±0.05 μm) to produce 50% ± 5 % of the maximum rate of aggregation. Platelet aggregation was assessed by established spectrophotometric methods with a Chrono-Log aggregometer (Chrono-Log Corp, Havertown, PA). Statistical analyses with the use of methods for building single and multi-factor logistic regression models and neural network models were conducted to specify the major determinants of risk for developing DME [12]. Analysis tasks included (1) specifying independent variables which have the most significant effect on the risk of developing DME in DR and (2) building a model for predicting the risk of DME in patients with DR. Results and Discussion Logistic regression models were developed and subjected to analysis to identify independent variables associated with the risk for DME and assess the association of these variables with this risk. In the first stage of the study, we developed single-factor models predicting DME based on platelet aggregation values for each of the agonists (Table 1).
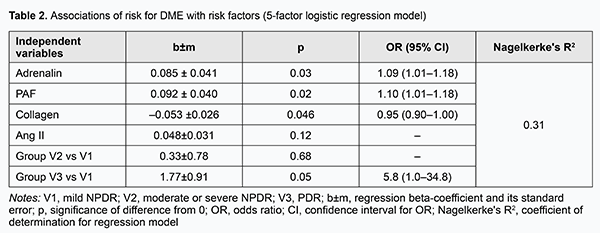
The risk for DME was mildly associated (p < 0.05) with the levels of platelet aggregation induced by ANG II, collagen and PAF, whereas the relationships of the risk with the levels of platelet aggregation induced by the two other agonists, adrenaline and ADP, were not statistically significant (p > 0.05). In addition, the risk for DME increased with an increase in ANG II-induced percent of platelet aggregation (OR=1.05; 95 % CI, 1.00-1.09; p=0.04) and with an increase in PAF-induced percent of platelet aggregation (OR=1.07; 95 % CI, 1.00-1.14; p=0.048), and decreased with an increase in collagen-induced percent of platelet aggregation (OR=0.96; 95 % CI, 0.93-0.99; p=0.007). Therefore, one may state that the potential of single-factor logistic regression models to predict DME based on induced platelet aggregation is limited. We developed multifactor logistic regression models to identify a set of independent variables associated with the risk for DME. The following independent variables were subjected to analysis: age, gender, group (stage of DR), blood glucose level, and ANG II-, ADP-, adrenaline-, PAF-, and collagen-induced platelet aggregations. Stepwise inclusion/exclusion of independent variables into the regression model was determined by F probability of p < 0.1 for inclusion and p > 0.3 for exclusion. In this way, a set of five significant risk factors for DME (group or stage of DR, and ANG II-, adrenaline-, PAF-, and collagen-induced platelet aggregations) was selected, and used to build a multifactor logistic regression model for predicting the risk of DME (Table 2). There were moderate associations of the risk of DME with selected independent variables (group (stage of DR), and ANG II-, adrenaline-, PAF-, and collagen-induced platelet aggregations). In addition, the risk for DME increased with one per cent increases in adrenaline-induced percent of platelet aggregation (OR=1.09; 95 % CI, 1.01-1.18) and in PAF-induced percent of platelet aggregation (OR=1.10; 95 % CI, 1.01-1.18), and decreased with a one per cent increase in collagen-induced percent of platelet aggregation (OR=0.95; 95 % CI, 0.90-1.00). Moreover, there was a tendency to increase in the risk for DME with an increase in ANG II-induced platelet aggregation. After adjustment for other risk factors, patients with PDR had higher odds of developing DME than those with NPDR (OR=5.8; 95 % CI, 1.0-34.8).
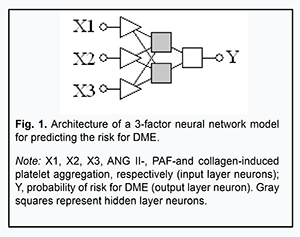
In the current study, we demonstrated that the stage of DR can be predicted based on the two independent variables, collagen- and ADP-induced platelet aggregations. Since this association was found to be non-linear, it was reasonable to try to develop a non-linear neural network model (specifically, a multilayer perception model, or MLP) for predicting the risk for DME based on the already preselected five independent variables. Neural network analysis revealed non-linear associations of this risk with only three independent variables (ANG II-, PAF-, and collagen-induced platelet aggregations) of these five. Fig. 1 presents the architecture of the neural network prediction model developed based on the selected set of independent variables.
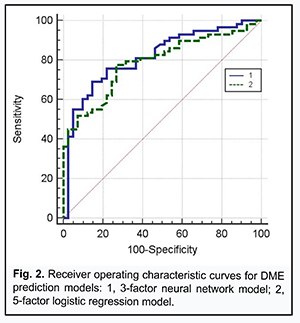
Receiver operating characteristic (ROC) curve analysis was used to check the two risk prediction models, the neural network prediction model based on the three independent variables and the logistic regression model based on the five independent variables, for adequacy (Fig. 2).
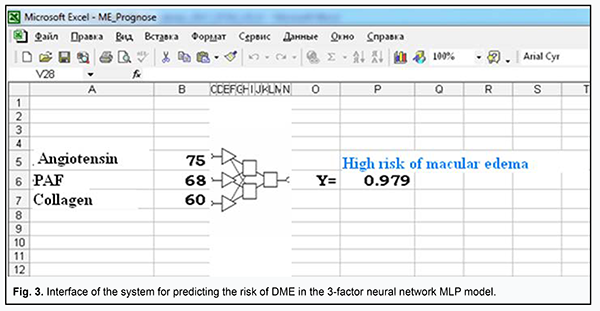
The area under curve for the former model was AUCMLP=0.82 (95% CI, 0.73-0.89; P < 0.0001), and for the latter model, AUClog=0.79 (95% CI, 0.69-0.86; P < 0.0001), indicating that both developed models were adequate for predicting the risk of DME in DR. At the same time, a decrease in the number of independent variables (from 5 to 3) for the MLP model was not accompanied by deterioration of model performance in terms of prediction characteristics, indicating that (a) the risk of DME in DR was associated with the levels of ANG II-, PAF-, and collagen-induced platelet aggregations, and (b) the identified association was significantly non-linear and could not be completely represented in the logistic (multiplicative) model. In order to choose an appropriate cutoff level for the MLP model, we used the method for minimization of mean cumulative error of false positive (FP) and false negative (FN) predictions (Zweig & Campbell, 1993). False positive and false negative costs were set to 1 (FP=FN=1). The following prediction characteristics were obtained for the MLP model while choosing appropriate cutoff level: (a) sensitivity, 77.1% (95% CI, 64.5%-86.8%); (b) specificity, 78.1% (95% CI, 62.4%-89.4%); (c) positive predictive value (edema is indeed present if the model predicts it), 83.9% (95% CI, 74.3%-90.4%); and (d) negative predictive value (edema is indeed absent if the model predicts a low risk of edema), 69.6% (95% CI, 58.4%-78.8%). The model not only confirmed previous reports on possible causes of DME (chronic inflammation with associated fibrosis of the retina and choroid and activation of the renin-angiotensin system [1]), but also demonstrated the interplay of these factors of DR pathogenesis in the development of DME. Therefore, our in vitro study of the potential of ANG II, PAF, and collagen to interplay in platelet activation not only improved our understanding of the mechanisms of thrombogenesis in DR and DM2, but also allowed to assess possible risks for the development of DME associated with activation of the renin-angiotensin system and chronic inflammation with associated fibrosis of the retina. The model was implemented in Microsoft Excel (“ME_Prognose.xls”) spreadsheet for ease of use in clinical practice. The interface of the prediction system is presented in Fig. 3.
In the model, the user will enter patient’s agonist-induced platelet aggregation values, and interpret the dependent variable (Y), the probability, as an assessment of how likely it is that DME occurs. The cut-off value Ycrit =0.502 allows assessment of the probability that DME will occur to a given patient: if Y>Ycri, the model yields a positive prediction (a “High risk of macular edema”); otherwise, the prediction is negative. Analysis of functional activity of platelets in DR allowed us to form mental representations of the factors which can provoke the platelet proaggregating status and cause retinal microcirculatory impairments and DME. Of the identified risk factors for DME (activation of the sympathoadrenal system, activation of the renin-angiotensin system and inflammation), it was platelet hyperreactivity to ANG II which could cause the development of DME. There could be various mechanisms for this effect. In hyperglycemia, elevated ANG II levels through stimulation of AT1 receptors cause breakdown in the retinal blood barrier resulting in upregulation of vascular endothelial growth factor (VEGF), intercellular matrix accumulation, and subsequent fibrosis [13, 14]. In addition, hyperglycemia stimulates up-regulation of angiotensinogen through the hexosamine metabolism pathway, and thus increases the synthesis of Ang II [15]. Blockade of AT1 receptors in endothelial cells and pericytes provides cytoprotective effects. An experimental study has demonstrated that inhibition of the renin-angiotensin system resulted in attenuation of the increased retinal vascular permeability in DM2, with restoration of intracellular protein trafficking across vessel walls [16]. Results of recent clinical trials have demonstrated the role of renin-angiotensin system blockers (angiotensin-converting enzyme inhibitors and ANG II receptor blockers) in reduction in the progression and/or induction of the regression of DR and DME [17]. Conclusion First, we used modeling to establish that the increased platelet responses to ANG II, PAF and collagen are predictors of risk for DME in patients with DR and DM2. Second, we developed the neural network model for predicting the risk for DME based on the analysis of ANG II-, PAF- and collagen-induced platelet aggregation.
References 1.Pasyechnikova NV. [Diabetic maculopathy: current aspects of the pathogenesis, clinical manifestations, diagnosis and treatment]. Kyiv: Karbon LTD; 2010. Russian. 2.Grassi MA, Tikhomirov A, Ramalingam S, Lee KE, Hosseini SM, Klein BE, et al. Replication analysis for severe diabetic retinopathy. Invest Ophthalmol Vis Sci. 2012 Apr 30;53(4):2377-81. 3.Fabrikantov OV, Gurko TS. [Diabetic maculopathy: epidemiology, pathogenesis and current approaches to treatment (literature review)]. Vestnik TGU. 2014;19(2):744-7. Russian. 4.Amirov AN, Abdullaieva EA, Minkhuzina EL. [Diabetic macular edema: pathogenesis, diagnosis clinical manifestations, and treatment]. Kazanskii meditsinskii zhurnal. 2015:96(1):70-6. Russian. 5.Dabir SS, Das D, Nallathambi J, Mangalesh S, Yadav NK, Schouten JS. Differential systemic gene expression profile in patients with diabetic macular edema: Responders versus nonresponders to standard treatment. Indian J Ophthalmol. 2014 Jan;62(1):66-73. 6.Chen E, Looman M, Laouri M, Gallagher M, Van Nuys K, Lakdawalla D, Fortuny J. Burden of illness of diabetic macular edema: literature review. Curr Med Res Opin. 2010 Jul;26(7):1587-97. Review. 7.Stefanini FR, Badaró E, Falabella P, Koss M, Farah ME, Maia M. Anti-VEGF for the management of diabetic macular edema. J Immunol Res. 2014;2014:632307. 8.Mogilevskyy SIu, Panchenko IuO, Ziablitsev SV, Natrus LV. [Platelet aggregation impairment as a factor for the development of diabetic maculopathy and diabetic macular edema in patients with non-proliferative diabetic retinopathy in type 2 diabetes mellitus]. Arkhiv oftalmologii Ukrainy. 2018; 8(3):26–31. Ukrainian. 9.Hudz AS, Mogilevskyy SIu, Maksymtsiv ML. Functional status of platelets in type 2 diabetes patients showing no diabetic fundus changes. J Ophthalmol (Ukraine). 2017;1:20-4. 10.Rykov SO, Burdei AV, Ziablitsev SV, Mogilevskyy SIu. Predicting the development and progression of primary open-angle glaucoma based on the determination of GST gene polymorphisms. J Ophthalmol (Ukraine). 2018;4(483):11-6. 11.Mogilevskyy SIu, Ziablitsev SV, Denisiuk LI, Gur’ianov VG. Mathematical analysis of the effect of Pro72Arg polymorphism in the TP53 gene on the emergence and progression of POAG. J Ophthalmol (Ukraine). 2016;6:32-7. 12.Mun SA, Glushkov AN, Shternis TA. [Regression analysis in medical and biological research]. Kemerovo: KemGMA; 2012. Russian. 13.Lally DR, Shah CP, Heier JS. Vascular endothelial growth factor and diabetic macular edema. Surv Ophthalmol. 2016 Nov - Dec;61(6):759-68. 14.Li JK, Wei F, Jin XH, Dai YM, Cui HS, Li YM. Changes in vitreous VEGF, bFGF and fibrosis in proliferative diabetic retinopathy after intravitreal bevacizumab. Int J Ophthalmol. 2015;8(6):1202-6. 15.Favre GA, Lebrun P, Lopez P, Butori C, Hofman P, Esnault VL, Van Obberghen E. Constitutive activation of the renin-angiotensin system reduces visceral fat and improves glucose tolerance in mice. J Renin Angiotensin Aldosterone Syst. 2014 Dec;15(4):396-409. 16.Kim JH, Kim JH, Yu YS, Cho CS, Kim KW. Blockade of angiotensin II attenuates VEGF-mediated blood-retinal barrier breakdown in diabetic retinopathy. J Cereb Blood Flow Metab. 2009 Mar;29(3):621-8. 17.Porta M, Taulaigo AV. The changing role of the endocrinologist in the care of patients with diabetic retinopathy. Endocrine. 2014 Jun;46(2):199-208. The authors certify that they have no conflicts of interest in the subject matter or materials discussed in this manuscript.
|