J.ophthalmol.(Ukraine).2019;2:7-13.
|
http://doi.org/10.31288/oftalmolzh20192713 Received: !2 November 2019; Published-online: 23 April 2019 Assessing OCTA changes in morphology and structure of retinal microvascular bed in patients with exudative AMD N.S. Lutsenko, Dr Sc (Med), Prof.; O.A. Rudycheva, Cand Sc (Med); O.A. Isakova, Cand Sc (Med); T.S. Kyrylova, Resident Zaporizhzhia Medical Academy of Post-Graduate Education; Zaporizhzhia (Ukraine) E-mail: tetianakyrylova@gmail.com TO CITE THIS ARTICLE: Lutsenko NS, Rudycheva OA, Isakova OA, Kyrylova TS. Assessing OCTA changes in morphology and structure of retinal microvascular bed in patients with exudative AMD. J.ophthalmol.(Ukraine).2019;2:7-13. http://doi.org/10.31288/oftalmolzh20192713 Background: Optical coherence tomography angiography (OCTA) enables measuring characteristics of the retinal microvascular bed such as vascular plexus density and foveal avascular zone (FAZ) area. Purpose: To assess the OCTA changes in morphology and structural characteristics of the retinal microvascular bed in patients with exudative age-related macular degeneration (AMD). Materials and Methods: Forty seven patients with exudative AMD (51 eyes) and 13 healthy controls (22 eyes) were included in the study. OCTA was used to measure superficial plexus FAZ area (SPFA), deep plexus FAZ area (DPFA), vessel density and retinal thickness. Patients were divided into three groups based on the ratio of SPFA to DPFA: Group 1 (SPFA/DPFA < 0.6; 15 eyes), Group 2 (0.6 ≤ SPFA/DPFA < 0.8; 17 eyes), and Group 3 (SPFA/DPFA ≥ 0.8; 19 eyes). Results: Deep plexus FAZ area in all groups of patients was increased and superficial plexus FAZ area in Group 3 was significantly increased compared to controls. Patients in Group 1 exhibited mostly apparent signs of retinal edema and minimal alterations in the retinal microvascular bed. Patients in Group 2 had greater retinal thickness, but moderately lower plexus vessel density compared to controls. Patients in Group 3 had substantially lower superficial plexus vessel density and insubstantially altered retinal thickness compared to controls. Conclusion: OCTA enables assessing the changes in morphology and structure of the retinal microvascular bed, measuring FAZ area and vessel density in patients with exudative AMD. Keywords: optical coherence tomography angiography, age-related macular degeneration, foveal avascular zone, vessel density
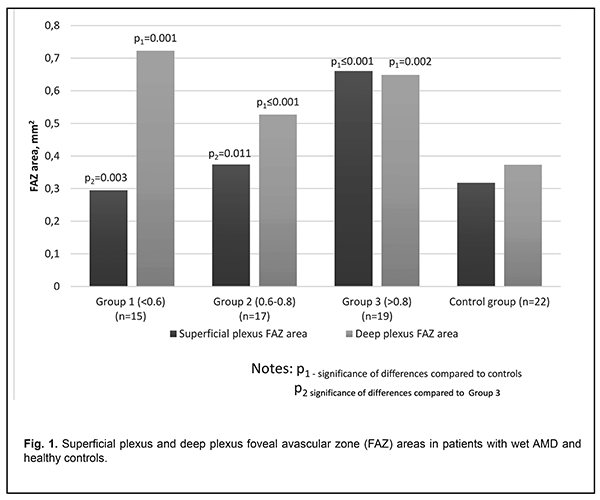
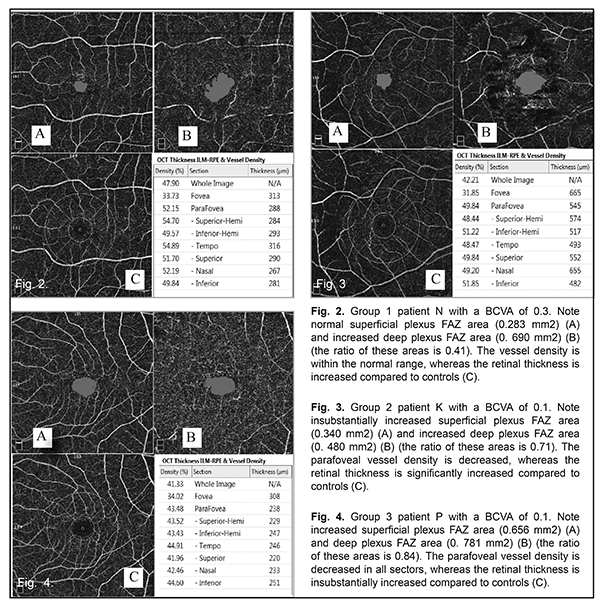
Introduction Age-related macular degeneration (AMD) complicated by choroidal neovascularization is a major cause of central vision loss in the elderly [1]. Fluorescence angiography (FA), indocyanine green angiography and optical coherence tomography (OCT) are the most common imaging techniques used in multimodal imaging of this disorder [2]. The advent of OCT and, in particular, OCT angiography (OCTA), has created new opportunities for investigating pathological retinal changes in posterior eye disorders, in particular, wet AMD. OCTA is a relatively new non invasive, dyeless technology that is now routinely and very widely used by ophthalmologists for 3D imaging of the retina and choroidal microcirculation [3]. The method uses variations in the phase and intensity of backscattered light to detect moving red blood cells in the retinal tissue [4]. OCT angiograms are co-registered with OCT B scans that are obtained concurrently, which allows for comprehensive assessment of functional as well as morphological changes in the retina [5]. OCTA studies have confirmed the complex structure of the retinal capillary bed which incorporates both superficial and deep vascular plexuses [6, 7]. Because each plexus has a specific function, performing separate analyses of each plexus will contribute to knowledge on the pathophysiology of retinal disease [8]. OCTA enables not only detailed visualization of the retinal microvascular bed, but also allows obtaining measurements of characteristics of this bed. The most practically significant and commonly used characteristics are retinal plexus density and area of the foveal avascular zone (FAZ) [6, 9]. To the best of our knowledge, there have been no reports on studies of the changes in FAZ area and retinal plexus density in wet AMD. The FAZ is an avascular zone located in the central macula (also known as fovea), and its dimensions vary among healthy individuals [10, 11]. In addition, in a retinal disease, the FAZ may undergo changes or deformation, which may be associated with visual acuity loss [12, 13, 14, 15]. Although increased FAZ area has been found in diabetic retinopathy and central retinal vein occlusion, a wide variation in FAZ area among normal eyes is still a substantial barrier for using this characteristic in a routine clinical practice as diagnostic criterion for retinal disease [16]. In a particular patient, the FAZ area, therefore, not always can be categorized as definitely normal or pathologically increased. Given the above and reports that in eyes of healthy individuals, FAZ area was significantly larger in the deep plexus (P < 0.0001) compared with superficial plexus [10], we decided to determine ratio of superficial plexus FAZ area to deep plexus FAZ are, and to investigate the morphometrics and retinal mocrovascular bed structure characteristics in wet AMD patients with various ratio values. The purpose of this study was to assess the OCTA changes in morphology and characteristics of the retinal microvascular bed in patients with exudative AMD. Materials and Methods Forty seven patients (27 women and 20 men; 51 eyes) with a first-diagnosed exudative AMD accompanied by active choroidal neovascularization were included in the study. Patient mean age was 71.3±10.05 years (range, 43 – 91). Inclusion criteria were untreated subretinal neovascularization in the presence of wet AMD. Exclusion criteria were other retinal disease that may influence the significance of study results, retinal angiomatous proliferation (type 3) or polypoidal choroidal vasculopathy. The study group included patients with subfoveal choroidal neovasculatization (CNV) lesions (classical CNV, type 1, 22 eyes; subclinical CNV, type 2, 16 eyes, and mixed CNV, type 4, 16 eyes). OCT- and OCTA-based morphologic criteria of lesion activity in neovascular AMD [17] were used. Cystoid macular edema, serous neuroepithelial and/or RPE detachment, and subretinal hemorrhage, in the presence of signs of subretinal neovascular membrane (SNM; presence of a focus of increased reflectivity above or below the RPE and/or dome-shaped RPE detachment with a region of non-uniform reflectivity underneath the RPE) were considered OCT evidence of active SNM. Presence of secondary vascular branching, numerous thin dense capillaries with frequent anastomoses, vessel loops and peripheral arcades were considered angiographic evidence of active SNM [17]. The control group involved 13 age- and gender-matched controls (22 eyes; 9 women and 7 men; mean age, 66.1±7.6 years (range, 55 – 77)). Inclusion criteria for the controls were age older than 55 years, best-corrected visual acuity ≥ 1.0 and absence of ocular disease. Informed consent was obtained from all participants. The study protocol was approved by the local ethics committee. Each patient underwent eye examination including visual acuity, perimetry, tonometry, biomicroscopy and ophthalmoscopy. In addition, the AngioVue OCT-A system (RTVue XR OCT Avanti, Optovue, Inc., Fremont, CA) was used for split-spectrum amplitude-decorrelation angiography (SSADA) measurements with OCT. Eyes were examined with dilated pupils (tropicamide 1%) to enhance readability of scanned images. Poor OCTA images, which were defined as those with a signal strength index (SSI) less than 50 due to motion artifacts or media opacity were excluded from the analysis [18]. Quantitative analysis of retinal microvascular bed characteristics (vascular plexus density and FAZ area) was performed using AngioRetina mode (6 × 6-mm scans), software AngioAnalytics (Optovue). OCTA-based assessment of morphometric characteristics and characteristics of the retinal microvascular bed state (superficial plexus FAZ area (SPFA), and deep plexus FAZ area (DPFA), vessel density and retinal thickness) was performed. Calculation of FAZ area was performed on the superficial retinal OCTA slab (or the deep retina slab) and using the non-flow function of the imaging software. Calculation of vessel density and retinal thickness within a 300μm width perimeter surrounding the FAZ was performed using the density option. The parafoveal zone was divided into four sectors (temporal, superior, nasal and inferior). Patients were divided into three groups based on the ratio of SPFA to DPFA: Group 1 (SPFA/DPFA < 0.6; 15 eyes), Group 2 (0.6 ≤ SPFA/DPFA < 0.8; 17 eyes), and Group 3 (SPFA/DPFA ≥ 0.8; 19 eyes). The ratio among the 22 control eyes varied from 0.7 to 1.0. Statistical analyses were conducted using Statistica 10.0 (StatSoft, Tulsa, OK, USA) software. The Student t test was used to assess statistical significance. The level of significance p ≤ 0.05 was assumed. Data are presented as mean ± standard deviation (SD). Results We investigated changes in BCVA, superficial plexus FAZ area, deep plexus FAZ area, superficial plexus vessel density and retinal thickness with changes in the ratio of superficial plexus FAZ area to deep plexus FAZ area. We found no significant difference (р > 0.05) in any of the parameters studied among eyes with different types of CNV. The mean BCVA in groups 1, 2 and 3 was 0.37±0.26, 0.29±0.28 та 0.27±0.21, respectively, with no significant difference among the groups. The superficial plexus FAZ area was found to be significantly larger only in Group 3 compared to controls (0.661±0.43 mm2 vs 0.318±0.105 mm2, respectively, p<0.01), whereas the deep plexus FAZ area was found to be significantly larger in Groups 1, 2 and 3 (0.723±0.46 mm2, 0.527±0.139 mm2, and 0.649±0.375 mm2, respectively) compared to controls (0.373±0.118 mm2, р < 0.01 for each comparison). There was no significant difference in superficial plexus FAZ area in Groups 1 and 2 compared to controls (0.295±0.125 mm2, 0.374±0.104 mm2 and 0.291±0.105 mm2, respectively, р > 0.05) (Fig. 1). Therefore, in Group 1, only the deep plexus FAZ area was larger than in controls. In addition, in Group 2, the superficial plexus FAZ area was moderately larger and the deep plexus FAZ area was larger than in controls. Moreover, in Group 3, both the superficial plexus FAZ area and deep plexus FAZ area were substantially larger than in controls (Figs. 2, 3, 4).
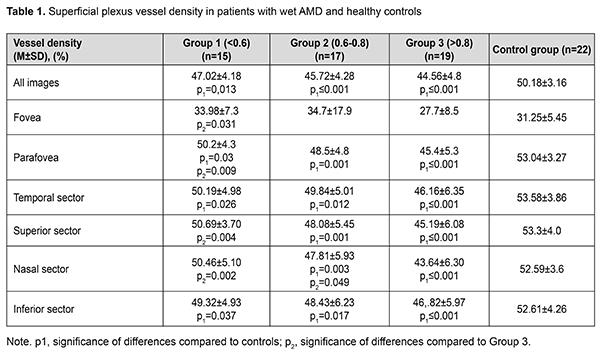
Our findings with regard to superficial plexus vessel density are presented in Table 1.
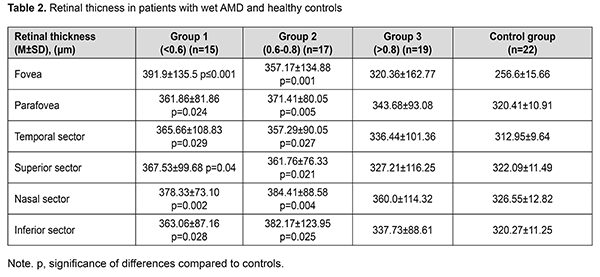
No significant difference (р>0.05) in foveal vessel density was seen between any group of patients and controls. The mean parafoveal vessel density in groups 1, 2 and 3 was 50.2±4.3%, 48.5±4.8%, and 45.4±5.3%, respectively, which was 5.4% (р<0.05), 8.6% and 14.4% (both р<0.01), respectively, less compared to controls (53.04±2.37%). In groups 2 and 3, the mean parafoveal vessel density in each of the four sectors was significantly less than in controls (р<0.05 and р<0.01, respectively). In group 1, the mean parafoveal vessel density in the temporal and inferior sectors (up to 50.19±4.98% and 49.32±4.93%, respectively), but not in the nasal and superior sectors, was significantly less than in controls (53.58±3.86% and 52.61±4.26%, respectively, р < 0.05), indicating insubstantial retinal microvascular bed alterations in this group, likely due to the age of patients. Our findings with regard to retinal morphometric changes in study groups are presented in Table 2.
Retinal thickness was significantly (р<0.05) increased in Groups 1 and 2 in all thickness measurement zones compared to controls, but there was no significant difference (р>0.05) in retinal thickness for any thickness measurement zone in Group 3 compared to controls. In Groups 1, 2 and 3, total foveal thickness was 52.7%, 39.2%, and 24.8%, respectively, increased, and total parafoveal thickness was 12.9%, 15.9%, and 7.3%, respectively, increased, compared to controls. It can be concluded from the above that patients in Group 1 exhibited mostly apparent signs of retinal edema and minimal alterations in the retinal microvascular bed. Patients in Group 2 had greater retinal thickness, but moderately lower plexus vessel density compared to controls. Patients in Group 3, as opposed to those in Groups 1 and 2, had substantially lower superficial plexus vessel density and insubstantially altered retinal thickness compared to controls, which should be taken in account when selecting the treatment strategy for these patients. Discussion FA has been traditionally considered the gold standard for diagnosing vascular changes in AMD [1, 2]. FA, but not OCTA, uses dye to assess the permeability of walls of normal or newly formed vessels. However, with the help of OCTA, vascular abnormalities can be identified using an approach based on the assessment of vessel depth and imaging the vessels above or below the RPE. OCTA images are not obscured by leakage from damaged vessels, enabling a more accurate assessment of the borders and area of capillary obstruction and neovascular network. OCT angiograms are co-registered with OCT B scans that are obtained concurrently, which enables visualization of subretinal fluid accumulation at the neovascular membrane, allowing for obtaining the information that is similar to the information on leakage in retinal FA. Another benefit of OCTA is that it enables a separate assessment of abnormalities of different retinal and choroidal plexuses [19]. In addition, OCTA allows for quantitative assessment of retinal blood flow, and measurements of the vessel density using OCTA showed relatively good repeatability for various retinal diseases [20]. Therefore, OCTA is a dyeless technique that enables accurate software-based assessment and quantification of FAZ area and retinal microvascular bed structure at various levels. The FAZ is an anatomic area of a special interest for clinicians since changes in the metrics related to this area may mirror the onset and progression of retinal disease. It has been reported [10, 21] that, in normal eyes, the superficial plexus FAZ area varied from 0.25 to 0.34 mm2, whereas the deep plexus FAZ area varied from 0.37 to 0.48 mm2, which is in line with our findings for healthy controls. FAZ area and vessel density have been investigated in various pathological conditions. Thus, increased OCTA measures of FAZ area and decreased OCTA measures of retinal vascular plexus density may reflect retinal pathologies such as diabetic retinopathy or retinal vessel occlusion 13, 14, 22, 23]. In a study by Stavrev et al [24], patients with different stages of dry AMD demonstrated no significant changes in FAZ area compared to healthy controls. To the best of our knowledge, there have been no studies on the changes in FAZ area and retinal microvascular bed structure in exudative AMD. The results of the current study evidence an increased deep plexus FAZ area in all patients with wet AMD irrespective of changes in the retinal microvascular bed and retinal thickness. In addition, there was a group of patients with a normal superficial plexus FAZ area, marked retinal edema and no decreased plexus density, and a group with an increased superficial plexus FAZ area, decreased microvascular bed capacity and insubstantial retinal edema. There have been reports on negative correlation between superficial plexus FAZ area and central retinal thickness in normal eyes [10, 20], which was also observed in the control group of the current study (r = -0.62; р<0.05). However, no statistically significant correlation was found between FAZ area and retinal thickness in patients with exudative AMD. Conclusion First, OCTA is a contactless and non-invasive technique for examination of retinal microvascular bed structure which enables us to perform quantitative measurements related to the retinal vascular plexus (retinal plexus density and FAZ area). Second, deep plexus FAZ area was 1.5 to1.9 times increased compared to controls (р<0.01) in all groups of patients with exudative AMD. Third, superficial plexus parafoveal vessel density in Group 3 of exudative AMD patients (45.4±5.3%) was statistically significantly lower than in Group 1 (50.2±4.3%) and controls (53.04±3.27%). Finally, retinal morphological changes in eyes with exudative AMD do not reflect changes in the vascular bed of retinal plexuses. In eyes with the ratio of superficial plexus FAZ area to deep plexus FAZ area (SPFA/DPFA) < 0.6, retinal thickness was increased, and there were no substantial changes in vessel density compared to controls. In eyes with the ratio > 0.8, there was no significant change in parafoveal thickness (343.68±93.08 μm), but vessel density was decreased compared to controls. References 1.Wong WL, Su X, Li X, Cheung CM, Klein R, Cheng CY, Wong TY. Global prevalence of age-related macular degeneration and disease burden projection for 2020 and 2040: a systematic review and meta-analysis. Lancet Global Health. 2014 Feb;2(2):e106-16. 2.Sulzbacher F, Kiss C, Munk M, Deak G, Sacu S, Schmidt-Erfurth U. Diagnostic evaluation of type 2 (classic) choroidal neovascularization: optical coherence tomography, indocyanine green angiography, an fluorescein angiography. Am J Ophthalmol. 2011 Nov;152(5):799-806.e1. 3.Lumbroso B, Huang D, Jia Y, Fujimoto JG, Rispoli M. Clinical guide to Angio-OCT: non invasive, dyeless OCT angiography. 1st ed. New Delhi: Jaypee Brothers Medical Publisher (P) Ltd; 2015. 4.Jia Y, Tan O, Tokayer J, Potsaid B, Wang Y, Liu JJ, Kraus MF, Subhash H, Fujimoto JG, Hornegger J, Huang D. Split-spectrum amplitude-decorrelation angiography with optical coherence tomography. Opt Express. 2012 Feb 13;20(4):4710-25. 5.Jia Y, Bailey ST, Wilson DJ, Tan O, Klein ML, Flaxel CJ, Potsaid B, Liu JJ, Lu CD, Kraus MF, Fujimoto JG, Huang D. Quantitative optical coherenсе tomography angiography of choroidal neovascularization in age-related macular degeneration. Ophthalmology. 2014 Jul;121(7):1435-44. 6.Jia Y, Bailey ST, Hwang TS, McClintic SM, Gao SS, Pennesi ME, Flaxel CJ, Lauer AK, Wilson DJ, Hornegger J, Fujimoto JG, Huang D. Quantitative optical coherence tomography angiography of vascular abnormalities in the living human eye. Proc Natl Acad Sci USA. 2015 May 5;112(18):E2395-402. 7.Savastano MC, Lumbroso B, Rispoli M. In vivo characterization of retinal vascularization morphology using optical coherence tomography angiography. Retina. 2015 Nov;35(11):2196-203. 8.Tultseva SN, Astakhov YS, Rukhovets AG, Titarenko AI. [Informative value of OCT-angiography in combination with regional hemodynamic studies in retinal vein occlusion]. Oftalmologicheskie Vedomosti. 2017;10(2):40-48. Russian. 9.Nesper PL, Roberts PK, Onishi AC, Chai H, Liu L, Jampol LM, Fawzi AA. Quantifying microvascular abnormalities with increasing severity of diabetic retinopathy using optical coherence tomography angiography. Invest Ophthalmol Vis Sci. 2017 May 1;58(6):BIO307-BIO315. 10.Samara WA, Say EAT, Khoo CTL, Higgins TP, Magrath G, Ferenczy S, Shields CL. Correlation of foveal avascular zone size with foveal morphology in normal eyes using optical coherence tomography angiography. Retina. 2015 Nov;35(11):2188-95. 11.Carpineto P, Mastropasqua R, Marchini G, Toto L, Di Nicola M, Di Antonio L. Reproducibility and repeatability of foveal avascular zone measurements in healthy subjects by optical coherence tomography angiography. Br J Ophthalmol. 016 May;100(5):671-6. 12.Balaratnasingam C, Inoue M, Ahn S, McCann J, Dhrami-Gavazi E, Yannuzzi LA, Freund KB. Visual acuity is correlated with the area of the foveal avascular zone in diabetic retinopathy and retinal vein occlusion. Ophthalmology. 2016 Nov;123(11):2352-2367. 13.Al-Sheikh M, Akil H, Pfau M, Sadda SR. Swept-source OCT angiography imaging of the foveal avascular zone and macular capillary network density in diabetic retinopathy. Invest Ophthalmol Vis Sci. 2016 Jul 1;57(8):3907-13. 14.Takase N, Nozaki M, Kato A, Ozeki H, Yoshida M, Ogura Y. Enlargement of foveal avascular zone in diabetic eyes evaluated by en face optical coherence tomography angiography. Retina. 2015 Nov;35(11):2377-83. 15.Freiberg FJ, Pfau M, Wons J, Wirth MA, Becker MD, Michels S. Optical coherence tomography angiography of the foveal avascular zone in diabetic retinopathy. Graefes Arch Clin Exp Ophthalmol. 2016 Jun;254(6):1051-8. 16.Krawitz BD, Mo S, Geyman LS, Agemy SA, Scripsema NK, Garcia PM, Chui TYP, Rosen RB. Acircularity index and axis ratio of the foveal avascular zone in diabetic eyes and healthy-controls measured by optical coherence tomography angiography. Vision Res. 2017 Oct;139:177-186. 17.Miotto S, Zemella N, Gusson E, Panozzo G, Saviano S, Scarpa G, Boschi G, Piermarocchi S. Morphologic criteria of lesion activity in neovascular age-related macular degeneration: a consensus article. J Ocul Pharmacol Ther. 2018 Apr;34(3):298-308. 18.Matsunaga D, Puliafito CA, Kashani AH. OCT angiography in healthy human subjects. Ophthalmic Surg Lasers Imaging Retina. 2014 Nov-Dec;45(6):510-5. 19.Lumbroso B, Huang D, Chen CJ, Jia Y, Rispoli M, Romano A, Waheed NK. Clinical OCT angiography atlas. 1st ed. New Delhi: Jaypee Brothers Medical Publisher (P) Ltd; 2015. 20.Al-Sheikh M, Tepelus TC, Nazikyan T, Sadda SVR. Repeatability of automated vessel density measurements using optical coherence tomography angiography. Br J Ophthalmol. 2017 Apr;101(4):449-452. 21.Tan CS, Lim LW, Chow VS, Chay IW, Tan S, Cheong KX, Tan GT, Sadda SR. Optical coherence tomography angiography evaluation of the parafoveal vasculature and its relationship with ocular factors. Invest Ophthalmol Vis Sci. 2016 Jul 1;57(9):OCT224-34. 22.Adhi M, Filho MA, Louzada RN, Kuehlewein L, de Carlo TE, Baumal CR, Witkin AJ, Sadda SR, Sarraf D, Reichel E, Duker JS, Waheed NK. Retinal Capillary Network and Foveal Avascular Zone in Eyes with Vein Occlusion and Fellow Eyes Analyzed With Optical Coherence Tomography Angiography. Invest Ophthalmol Vis Sci. 2016 Jul 1;57(9):OCT486-94. 23.Kashani AH, Lee SY, Moshfeghi A, Durbin MK, Puliafito CA. Optical coherence tomography angiography of retinal venous occlusion. Retina. 2015 Nov;35(11):2323-31. 24.Stavrev V, Sivkova N, Koleva-Georgieva D. Quantitative assessment of foveal avascular zone in patients with early and intermediate nonexudative age-related macular degeneration using optical coherence tomography-angiography. Open Journal of Ophthalmology. 2018;8(3):133-9. The authors certify that they have no conflicts of interest in the subject matter or materials discussed in this manuscript.
|