J.ophthalmol.(Ukraine).2018;4:39-43.
|
https://doi.org/10.31288/oftalmolzh201843943 Received: 25 June 2018; Published on-line: 31 August 2018 Color weakness in congenital color perception deficiency of various degrees A.V. Ponomarchuk, MD, N.I. Khramenko, Cand Sc (Med) Filatov Institute of Eye Diseases and Tissue Therapy, NAMS of Ukraine; Odessa (Ukraine) E-mail: khramenkon@gmail.com TO CITE THIS ARTICLE: Ponomarchuk AV, Khramenko NI. Color weakness in congenital color perception deficiency of various degrees. J.ophthalmol.(Ukraine).2018;4:39-43. https://doi.org/10.31288/oftalmolzh201843943
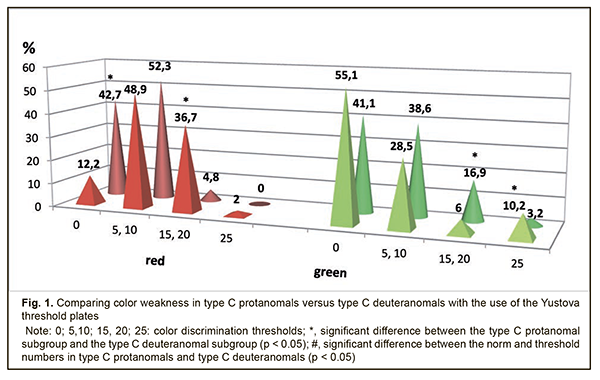
Background: The prevalence of congenital color vision defects (CCVD) is reported to be approximately 8% in males and 0.5% in females, and, therefore, the use of optimal tests capable of diagnosing these defects early and accurately, and with all the aspects of color perception deficiency addressed, is important. Purpose: To investigate color weakness in protans and deutans with congenital color vision defects varying in severity. Materials and Methods: The Yustova threshold plates were used to assess color discrimination thresholds in two groups, the protans (253 individuals) and the deutans (374 individuals). The former group included type A, type B, and type C protanomals (61, 49, and 64 individuals, respectively) and 79 protanopes, whereas the latter group included type A, type B, and type C deuteranomals (34, 124, and 127 individuals, respectively) and 89 deuteranopes. At baseline, patients underwent visual acuity assessment (using the Shevalev charts and Golovin-Sivtsev charts), refractometry, biomicroscopy and ophthalmoscopy. Patients were emmetropes, had the visual acuity of 1.0 in either eye, and had neither ocular nor systemic disease. Results: A colorimetric methodology revealed the features of color discrimination thresholds of the R receptor in protans, with mild to moderate red weakness in 31% of the type C protanomals, 85.6% of the type B protanomals, 70.3% of the type A protanomals, and with moderate to severe red weakness in 100% of the protanopes. A mild green weakness was found in 23.7% of the protans with any degree of color anomaly. Of the deutans, 51.8% exhibited a mild red weakness. In addition, 19.6% of the type C deuteranomals exhibited a mild green weakness, 55.5% of the type B deuteranomals exhibited mild to moderate green weakness, and 85.3% of the type A deuteranomals exhibited mild to moderate green weakness. Moreover, a green weakness of any degree was found in all the deuteranopes, with 51.9% of them exhibiting a severe green weakness. Conclusion: Congenital color vision defects are characterized not only by impaired spectral color perception, but also by apparent color weakness. Keywords: color perception, congenital defects, severity of the defect, color weakness The prevalence of congenital color vision defects (CCVD) is reported to be approximately 8% in males and 0.5% in females, and, therefore, early and accurate diagnosing these defects with optimal tests is important. Routine daily practice of the ophthalmologist requires a method or a set of methods for identifying color vision defects based on the physical color characteristics (spectral characteristics for red, green and blue colors), perception of color intensity (color weakness), and severity. In addition, this method or set of methods should be objectivisable. Currently used screening tests share the following disadvantage: they use either typographic printing (with a difficulty of matching the color and color intensity) or the devices that can only identify severe impairments in color perception thresholds. Discoloration of the plates in the test book, poor uneven prints, infringement of print standards, the potential for memorizing figures and tests, aging of test book pages due to multiple page turning when performing tests, the capability of identifying only a composite color perception threshold, and the long-duration testing are characteristic of typography-based tests. And the main thing is that a typography-based test cannot identify color weakness, i.e., subtle impairments in color perception [1]. Yustova [2] noted that colorimetry was not used to determine whether physical spectral characteristics of images in the plates were correct, although patient’s answers given while performing tests depend on the correctness of these characteristics. The tests were usually checked through the statistical analysis of screening results and results in individuals with apparent color vision defects, i.e., in an empirical way. Color matching tries were made, and colors were adjusted, with direct participation of color-blind observers serving in expert capacity [2]. In addition, Yustova [3] conducted the analysis of the Ishihara color vision tests and the Rabkin polychromatic charts, and concluded that they do not contain a test enabling (a) the discrimination between color-weak observers and dichromates and (b) quantitative assessment of the severity of reduction in the sensitivity of their color receptors [3]. Yustova defines color weakness as a type of color vision deficiency due to a loss of receptor sensitivity without qualitative changes in spectral sensitivity of receptors. Although the color-weak subject accepts colorimetric equivalences established by the normal subject, the color discrimination thresholds in the former subject are increased compared to the norm. Absolute loss of a particular wavelength sensitivity range of one of the three cone types leads to the most severe forms of color weakness, the condition called dichromatism, meaning that these individuals have only two functioning cone systems providing input. In addition, some individuals may have mixed forms of color vision resulting from combinations of color abnormality and color weakness. Yustova [2] noted that neither the Rayleigh equation, nor the test plates enable performing analysis of these forms with satisfactory completeness and accuracy. In addition, classification of the degree of color weakness cannot be performed based on the Ishihara or Rabkin plates [3]. The Yustova threshold plates for the study of color vision [4, 5] were developed with the introduction of additive colorimeters, and after conducting colorimetric physical studies. The purpose of the study was to investigate color weakness in protans and deutans with congenital color vision defects varying in severity. Materials and Methods The Yustova threshold plates were used to assess color discrimination thresholds in two groups, the protans (253 individuals) and the deutans (374 individuals). Each of the groups was composed of color anomals and color-blind individuals, as per the classification of Rabkin. Specifically, the former group was divided into type A, type B, and type C protanomal subgroups (61, 49, and 64 individuals, respectively) and protanope subgroup (79 individuals), whereas the latter group was divided into type A, type B, and type C deuteranomal subgroups (34, 124, and 127 individuals, respectively) and deuteranope subgroup (89 individuals). At baseline, patients underwent visual acuity assessment (using Shevalev charts and Golovin-Sivtsev charts), refractometry, biomicroscopy and ophthalmoscopy. Patients were emmetropes, had the visual acuity of 1.0 in either eye, and had neither ocular nor systemic disorder. Tests of the Yustova threshold plates were used to assess color discrimination thresholds. Plate tests Nos.1-5, 6-10 and 11-3 are used to test the R receptor (maximally sensitive to the red end of the spectrum), the G receptor (maximally sensitive to the middle, or green portion of the spectrum), and the B receptor (maximally sensitive to the blue end of the spectrum), respectively. The tests are characterized by discrete changes in color discrimination threshold, with thresholds of 0, 5-10, 15-20 and 25 corresponding to normal color discrimination, mild color weakness, moderate color weakness, and severe color weakness, respectively. With regard to a short-wave portion of the spectrum, the changes in digital values for mild and moderate color weakness were 7 and 14, respectively. Results Of the type C protanomals or type C deuteranomals, normal red color discrimination was found in 69.4%. Mild and moderate red color weakness were found in 17.1% and 14%, respectively, of type C protanomals, and mild red color weakness was found in 29.8% of type C deuteranomals (Fig. 1). In addition, of the type C protanomals or type C deuteranomals, 79.2% and 20.7% exhibited green sensitivity threshold within the normal range, and mild green color weakness, respectively.
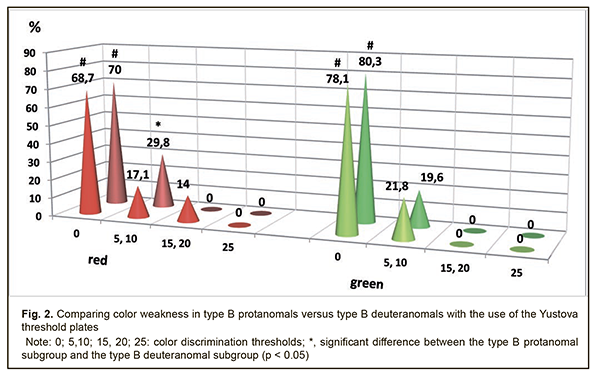
Of the type B protanomals, only 12% exhibited normal red color perception, and 48.9% and 36.7% exhibited mild and moderate red color weakness, respectively (Fig. 2). In addition, green sensitivity threshold within the normal range, mild green color weakness and moderate green color weakness were found in 48%, 28.5% and only 6%, respectively, of the type B protanomals.
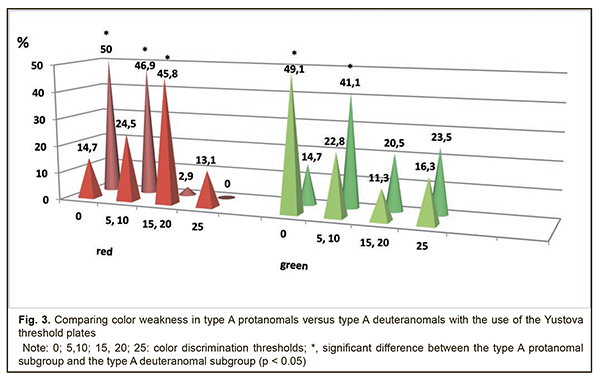
Of the type B deuteranomals, 42.7% and 52.3% exhibited normal red color perception and exhibited mild red color weakness, respectively. In addition, green sensitivity threshold within the normal range, mild green color weakness and moderate green color weakness were found in 48%, 38.6% and 16.9%, respectively, of the type B deuteranomals. Red sensitivity threshold was found to be within the normal range in 14.7% of the type A protanomals and in 50% of the type A deuteranomals, i.e., red sensitivity parameters in the latter were 35.3% better than in the former (p < 0.05). Mild red color weakness was found in 24.5% of the type A protanomals and in 49.6% of the type A deuteranomals (p < 0.02) (Fig. 3). Green sensitivity threshold was found to be within the normal range in 49.1% of the former and only in 14.7% of the latter (p < 0.01). In addition, mild, moderate and severe green color weakness were found in 48%, 38.6% and 16.9%, respectively, of the type A protanomals, versus 41.1%, 20.5% and 23.5%, respectively, of the type A deuteranomals (p < 0.01).
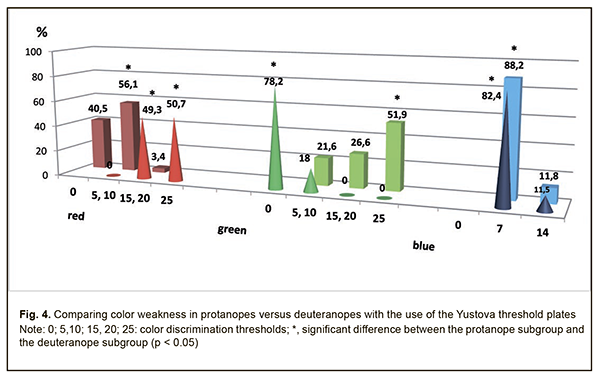
Color discrimination thresholds in color blind dichromats (protanopes and deuteranopes) Protanopes exhibited increased red sensitivity thresholds, with thresholds of 20 and 25 found in 49.3% and 50.7%, respectively, of the protanopes. Therefore, all the protanopes exhibited moderate to severe red weakness, with a mean red sensitivity threshold of 22.5±2.5 units. In addition, green sensitivity threshold was found to be within the normal range, and a mild green color weakness was found in 78.2% and 21.8%, respectively, of the protanopes, with a mean green sensitivity threshold of 5.9±1.9 units. Moreover, of the protanopes, 82.4% exhibited a mild blue color weakness (with a mean blue sensitivity threshold of 7 units), and only 11.5% exhibited a moderate blue color weakness (with a mean blue sensitivity threshold of 7.9±2.3 units). Red sensitivity threshold was found to be within the normal range, and a mild red color weakness was found in 44.5% and 56.1%, respectively, of the deuteranopes, with a mean red sensitivity threshold of 6.8±3.8 units (Fig. 4). In addition, mild, moderate and severe green color weaknesses were found in 21.6%, 26.5% and 51.9%, respectively, of the deuteranopes (p < 0.05), with a mean green sensitivity threshold of 19.2±7.6 units. Moreover, of the deuteranopes, 88.2% exhibited a mild blue color weakness, and only 11.8% exhibited a moderate blue color weakness, with a mean blue sensitivity threshold of 7.8±2.3 units (Fig. 4).
Conclusion
First, a colorimetric methodology revealed the features of color discrimination thresholds of the R receptor in protans, with mild to moderate red weakness in 31% of the type C protanomals, 85.6% of the type B protanomals, 70.3% of the type A protanomals, and with moderate to severe red weakness in 100% of the protanopes. Second, a mild green weakness was found in 23.7% of the protans with any degree of color anomaly. Finally, of the deutans, 51.8% exhibited a mild red weakness. In addition, 19.6% of the type C deuteranomals exhibited a mild green weakness, 55.5% of the type B deuteranomals exhibited mild to moderate green weakness, and 85.3% of the type A deuteranomals exhibited mild to moderate green weakness. Moreover, a green weakness of any degree was found in all the deuteranopes, with 51.9% of them exhibiting a severe green weakness. References
|