J.ophthalmol.(Ukraine).2018;4:11-16.
|
https://doi.org/10.31288/oftalmolzh201841116 Received: 30 May 2018; Published on-line: 30 August 2018 Predicting the development and progression of primary open-angle glaucoma based on the determination of GST gene polymorphisms S.O. Rykov1, Dr Sc (Med), Prof., A.V. Burdei1, Postgraduate, S.V. Ziablitsev2, Dr Sc (Med), Prof., S.Yu. Mogilevskyy1, Dr Sc (Med), Prof. 1 Shupik National Medical Academy of Postgraduate Education; Kyiv (Ukraine) 2 Bohomolets National Medical University; Kyiv (Ukraine) E-mail: sergey.mogilevskyy@gmail.com TO CITE THIS ARTICLE: Rykov SO, Burdei AV, Ziablitsev SV, Mogilevskyy SIu. Predicting the development and progression of primary open-angle glaucoma based on the determination of GST gene polymorphisms. J.ophthalmol.(Ukraine).2018;4:11-16. https://doi.org/10.31288/oftalmolzh201841116
Background: Epidemiological studies have demonstrated that primary open-angle glaucoma (POAG) is a complex multifactorial disease resulting from interaction of risk factors and gene polymorphisms. Previously, we have demonstrated the role of deletion polymorphisms of glutathione-S-transferase (GST) genes in the development and progression of POAG. Purpose: To predict the speed of POAG development and the speed of POAG progression as early as at patient presentation based on determination of GST gene (GSTТ1, GSTР1 and GSTM1) polymorphisms. Materials and Methods: Data of 172 patients (344 eyes) diagnosed with stage 1, 2, 3 or 4 POAG, and of 98 control group volunteers (196 eyes) diagnosed with no POAG, were included in the analysis. Two indices, SDPOAG (speed of POAG development, expressed as stage/life year), and SPPOAG (speed of POAG progression, expressed as stage/disease year), were used as measures for assessing speed of the pathological process. Polymorphisms of GSTP1, GSTM1 та GSTT1 were investigated by real-time polymerase chain reaction (PCR) using TaqMan Mutation Detection Assays (Life Technologies, Carlsbad, CA) and Gene Amp® 7500 PCR System (Applied Biosystems, Foster City, CA). Results and Discussion: We built an algorithm (computer program) for predicting the speed of the development and progression of POAG, with the potential to calculate these indices as early as at presentation. The GSTP1 Ile105Val polymorphism (with the presence of the mutant Val allele) and GSTM1 and GSTT1 deletion polymorphisms contributed more to prediction of dependent variables, SDPOAG and SPPOAG, than others. We found a significant effect of the combination of independent variables in the regression equation on the dependent variable SDPOAG, with a multiple correlation coefficient R of 0.801, a coefficient of determination R2 of 0.622, and an F value of 77.338 at p<0.0001. In addition, the regression equation for prediction for the speed of the progression of POAG had a multiple correlation coefficient R of 0.857, a coefficient of determination R2 of 0.734, and an F value of 73.450 at p<0.0001. Conclusion: The objectives of the study (i.e., to predict the age of onset of clinical manifestations of POAG and the speed of the development of POAG, with the potential to calculate them as early as at presentation) have been met. Keywords: primary open-angle glaucoma, GSTP1, GSTM1 and GSTT1 polymorphisms, speed of the development and progression
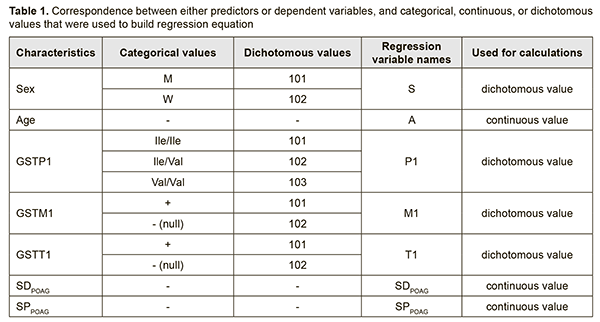
Introduction Primary open-angle glaucoma (POAG) accounts for around 80% of the total glaucoma cases and is a major cause of low vision and blindness among adults worldwide [1, 2]. By 2020, the number of people with open-angle glaucoma in the world is expected to increase to about 60 million [2]. The prevalence of POAG for 40-45 year olds is only about 0.7%, and it increases to 1.5-2% for 40-45 year olds, and to 10% for individuals aged ≥ 75 years [3, 4]. Risk factors for POAG can be divided into two categories: systemic and local. Systemic risk factors include old age, a racial or genetic predisposition to the disease, vascular disorders, hypercholesteremia, hypothyroidism, diabetes mellitus, and smoking. Local risk factors include anatomic features of the optic nerve, aqueous fluid drainage system, and ocular vascular structures, and the presence of concomitant eye disease [4, 5]. Epidemiological studies have demonstrated that POAG is a complex multifactorial disease resulting from interaction of risk factors and gene polymorphisms [6, 7]. The percentage influence of genetic factors on the susceptibility to develop POAG has been reported to vary from 20% to 60% [8, 9]. Previously, we have demonstrated the role of deletion polymorphisms of glutathione-S-transferase (GST) genes in the development and progression of POAG. Findings of molecular and genetic studies on the role of genetic factors in pathogenesis of a disease are utilized through models developed for predicting the progression of the disease or its complications. As individual genotype is invariable from life to death, accuracy of prediction using such models is rather high, and predictions will be relevant for long. Because our previous findings [10] have confirmed associations between polymorphic GST genotypes and POAG, we find it expedient to develop models describing the effect of genotype on disease progression and/or predicting the age at which the disease will progress to stage 2, 4 or 4. The purpose of the study was to predict the speed of POAG development and the speed of POAG progression as early as at patient presentation based on determination of GST gene (GSTТ1, GSTР1 and GSTM1) polymorphisms. Materials and Methods Stepwise, multifactorial regression models were built using the General Regression Model (GRM) package. Data of 172 patients (344 eyes) diagnosed with stage 1, 2, 3 or 4 POAG, and of 98 control group volunteers (196 eyes) diagnosed with no POAG, were included in the analysis. Glaucoma was staged according to the classification of Nesterov and Bunin (1976) and the classification of perimetry changes related to the stages of glaucoma. The study was conducted in accordance with the fundamental principles of the European Convention on Human Rights and Biomedicine, the Declaration of Helsinki, and the Order of Ministry of Health of Ukraine No 690 dated 23 September 2009. Patients with POAG and controls were familiarized with the study purpose and tasks. Two indices, SDPOAG (speed of POAG development, expressed as stage/life year), and SPPOAG (speed of POAG progression, expressed as stage/disease year), were used as measures for assessing speed of the pathological process. These indices increased with increasing stage of the pathological process (р < 0.05). Polymorphisms of GSTP1 were investigated by real-time polymerase chain reaction (PCR) using TaqMan Mutation Detection Assays (Life Technologies, Carlsbad, CA) and Gene Amp® 7500 PCR System (Applied Biosystems, Foster City, CA). Deletion polymorphisms of GSTT1 and GSTM1 were investigated by PCR with electrophoretic detection using AmpliSens® GSTT1/GSTM1-EPh kits (Interlabservis, Russia). Statistical analyses were conducted using Statistica 10.0 (StatSoft, Tulsa, OK, USA) software. Results and Discussion In order to ensure that the developed models are used in practice, independent variables (predictors) were selected based on the following main criteria: exhibiting either no change or consistent pattern of changes during patient’s life. In addition, patient’s data relevant to predictors had to be easily available at presentation. Therefore, the selected predictors included the sex, age and the results of genotyping for the investigated GST polymorphisms having a proven effect on the course of the disease [10]. Predictor weights were taken into account when building regression models. Table 1 demonstrates the correspondence between either predictors or dependent variables, and categorical, continuous, or dichotomous values that were used to build regression equations.
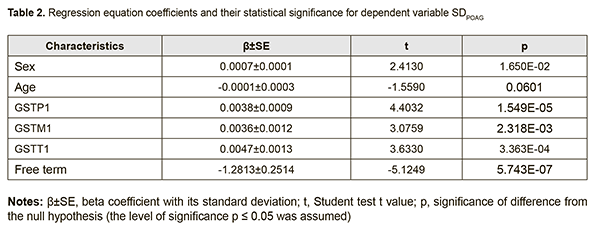
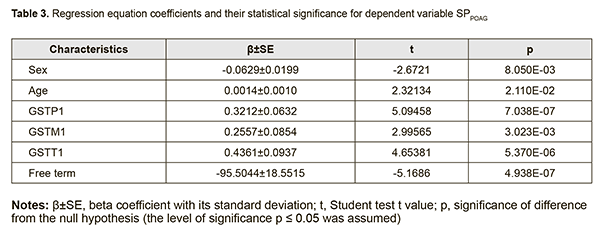
The coefficients of regression equations for dependent variables (SDPOAG and SPPOAG) and the significance of difference from the null hypothesis are shown in Tables 2 and 3, respectively.
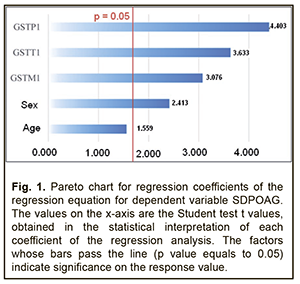
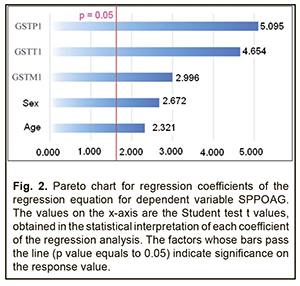
Analysis of beta coefficients of regressions found that, of all predictors considered, the GSTТ1, GSTP1, and GSTM1 contributed more to prediction of dependent variables, SDPOAG (0.0047±0.0013, 0.0038±0.0009, and 0.0036±0.0012, respectively), and SPPOAG (0.4361±0.0937, 0.3212±0.0632, and 0.2557±0.0854, respectively), than others. These predictors demonstrated direct associations with dependent variables. Somewhat another situation was observed with the two other predictors. The contribution of the Sex variable both to SDPOAG and SPPOAG were greater than that of the Age variable (0.0007±0.0001 vs 0.0001±0.0003 and 0.0629±0.0199 vs 0.0014±0.0010, respectively), and these predictors demonstrated opposite associations with dependent variables. In addition, analysis of the significance of difference from the null hypothesis for beta coefficients of predictors found that, due to its low significance (t=-1.559; p=0.060), the Age variable may be not considered when calculating the regression equation for SDPOAG. Pareto charts in Figs. 1 and 2 demonstrate statistical significances of regression beta coefficients for dependent variables, SDPOAG and SPPOAG, respectively, with the predictors arranged in descending order for Student test t values.
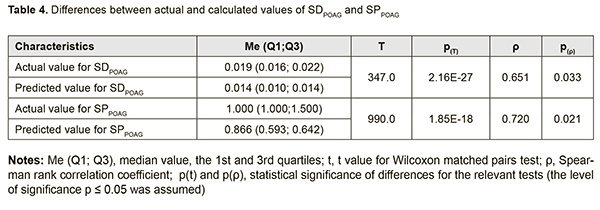
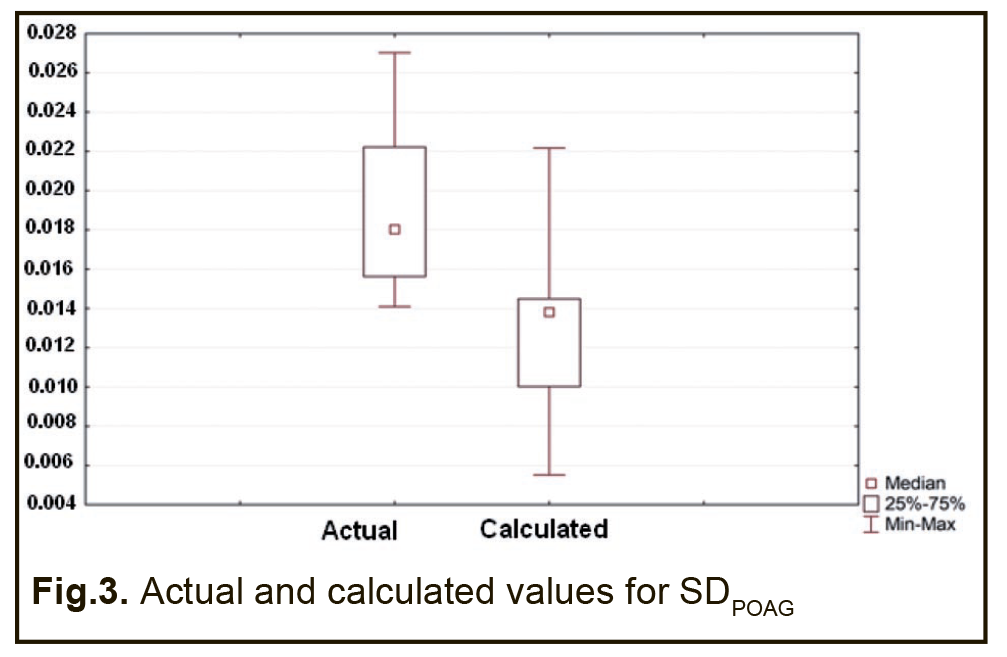
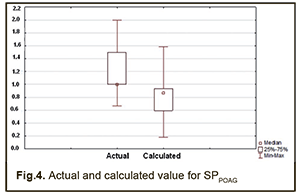
Therefore, a formula for calculation of SDPOAG can be presented as: SDPOAG=-1.28134+0.00067*S+0.00382*P1+0.00356*M1+0.00472*T1 (1), where S is a dichotomous value assigned to the Sex variable, P1 is a dichotomous value assigned to the GSTP1 variable, M1 is a dichotomous value assigned to the GSTM1 variable, T1 is a dichotomous value assigned to the GSTT1 variable. At large, we found a significant effect of the combination of independent variables on the dependent variable SDPOAG (R2=0.622 at F=77.338, p<0.0001). The R was 0.801, indicating that approximately 80.1% of the variance in SDPOAG was accounted for by the combination of independent variables in the model. A regression formula for calculation of SPPOAG can be presented as: SPPOAG =-95.5044-0.0629*S+0.014A+0.3212*P1+0.2557*M1+0.4361*T1 (2), where S is a dichotomous value assigned to the Sex variable, A is a continuous value assigned to the Age variable, P1 is a dichotomous value assigned to the GSTP1 variable, M1 is a dichotomous value assigned to the GSTM1 variable, T1 is a dichotomous value assigned to the GSTT1 variable. The regression equation for prediction for the speed of the progression of POAG had a multiple correlation coefficient R of 0.857, a coefficient of determination R2 of 0.734, and an F value of 73.450 at p<0.0001, pointing to achievement of acceptable results for the model built for predicting SPPOAG. In addition, table 4 presents the results of the analysis of differences between actual and calculated values for dependent variables SDPOAG and SPPOAG. Moreover, Figs 3 and 4 graphically demonstrate differences between actual and calculated values for SDPOAG and SPPOAG, respectively.
Therefore, the objectives of the study (i.e., to predict the age of onset of clinical manifestations of POAG and the speed of the development of POAG, with the potential to calculate them as early as at presentation) have been met. Conclusion We used regression analysis to build an algorithm (computer program) for predicting the speed of the development and progression of POAG, with the potential to calculate them as early as at presentation. Of all predictors considered, the GSTТ1, GSTP1, and GSTM1 contributed more to prediction of dependent variables, SDPOAG (0.0047±0.0013, 0.0038±0.0009, and 0.0036±0.0012, respectively), and SPPOAG (0.4361±0.0937, 0.3212±0.0632, and 0.2557±0.0854, respectively), than others. In addition, we found a significant effect of the combination of independent variables in the regression equation on the dependent variable SDPOAG, with a multiple correlation coefficient R of 0.801, a coefficient of determination R2 of 0.622, and an F value of 77.338 at p<0.0001. Furthermore, the regression equation for prediction for the speed of the progression of POAG had a multiple correlation coefficient R of 0.857, a coefficient of determination R2 of 0.734, and an F value of 73.450 at p<0.0001. References
|