J.ophthalmol.(Ukraine).2018;3:57-62.
|
https://doi.org/10.31288/oftalmolzh201835762 Clinical assessment of retinal ganglion cell complex changes in patient groups differing in severity of diabetic polyneuropathy M.A. Karliychuk, Cand Sc (Med), Assoc. Prof. Higher State Educational Establishment of Ukraine «Bukovinian State Medical University»; Chernivtsi (Ukraine) E-mail: mari13karli@gmail.com TO CITE THIS ARTICLE: Karliychuk MA. Clinical assessment of retinal ganglion cell complex changes in patient groups differing in severity of diabetic polyneuropathy. J.ophthalmol.(Ukraine).2018;3:57-62. https://doi.org/10.31288/oftalmolzh201835762
Background: To our knowledge, no clinical study has previously been performed to investigate changes in the retinal ganglion cell complex (GCC) in diabetes mellitus (DM) patients differing in severity of diabetic polyneuropathy (DPN). Purpose: To identify changes in the GCC in patients with DPN differing in severity of the disease. Materials and Methods: A total of 575 patients (1150 eyes) with type 2 diabetes mellitus were included in the prospective analysis. DPN was diagnosed in 210 (36.5%) patients with DM. In addition to routine eye examination, retinal OCT was performed, and the macular GCC was assessed. Results: We found that the state of GCC in patients with DPN depends on the severity of the disease, and mean average GCC thicknesses in DM patients with N1A, N1B, and N3 stages DPN, were 8.4%, 8.6%, and 11.0% lower than in controls (95.8 ± 8.2 μm) (p < 0.001). In addition, in N1A, N1B, N2A, N2B and N3 stages DPN, mean focal loss volume (FLV) values were 8.4, 8.7, 14.1, 14.3, and 15.3 times, respectively, lower, whereas mean global loss volume (GLV) values were 119.1%, 124.8%, 231.3%, 239.6%, and 358.1%, respectively, higher, than in age-matched healthy controls. Conclusion: Retinal ganglion cell complex changes depend on the severity of diabetic polyneuropathy. Keywords: diabetic polyneuropathy, diabetes mellitus, ganglion cell complex
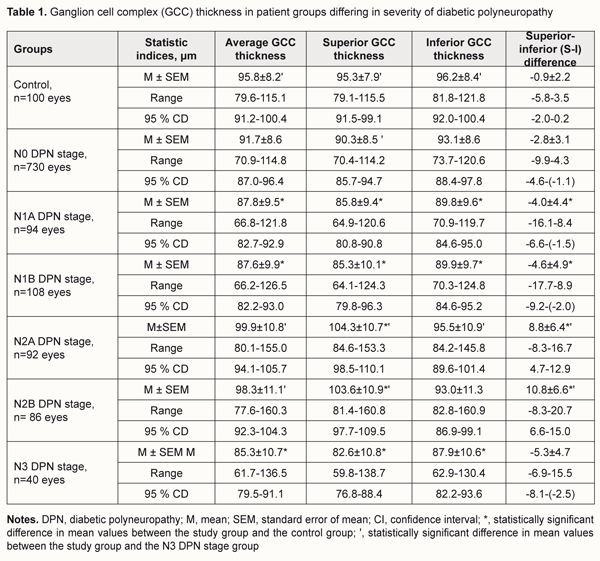
Introduction Injury to the nervous system is a major cause of reduced quality of life in patients in diabetes mellitus (DM) [1]. Early detection of signs of injury to the peripheral nervous system in patients with already diagnosed DM is an issue related to diagnosing diabetic polyneuropathy (DPN) [1, 2]. Since a number of changes in the retina, optic nerve and visual function have been hypothesized to be potential factors associated with DPN, assessment of these changes may be helpful in detecting and determining the severity of DPN [3, 4]. An animal study has demonstrated that in DM, retrograde axonal transport impairment of retinal ganglion cells (RGC) results in damage to their axons and cell bodies [5], and manifests as thinning of retinal ganglion cell layer (RGCL) and retinal nerve fiber layer (RNFL) [6-8]. In addition, in patients with DM, optical coherence tomography (OCT) revealed early thinning of RNFL, RGCL and other retinal layers before the onset of clinical signs of diabetic retinopathy [9-15]. The structural and functional retinal changes found in patients with DM before the onset of clinical signs of diabetic retinopathy provide evidence of the role of DPN in their origin. To our knowledge, no clinical study has previously been performed to investigate changes in the retinal ganglion cell complex (GCC) in DM patients differing in severity of DPN. The purpose of the study was to identify changes in the GCC in patients with DPN differing in severity of the disease. Materials and Methods A total of 575 patients (1150 eyes) with type 2 diabetes mellitus (T2DM) were included in the prospective analysis of the features of optic nerve damage. Inclusion criteria were no history of glaucoma; Goldmann IOP of 21 mmHg or less; emmetropic, hypermetropic or low myopic eyes; no cataract or mild age-related cataract; and no history of surgery or laser. The patients’ age ranged from 44 to 69 years (mean ± SD, 55.9±7.8 years). Four hundred and thirteen (71.8%), 93 (16.2%) and 69 (12.0%) had duration of DM of <5, 5-10 and >10 years, respectively. Three hundred and sixty five patients with DM (63.5%) were classified as those with no evidence for DPN (N0 stage as per the Guidelines for the diagnosis and outpatient management of diabetic peripheral neuropathy [9-10]). DPN was diagnosed in 210 (36.5%) patients with DM. Asymptomatic DPN was observed in 101 (17.5%) patients with DM, including 47 (8.1%) patients with N1A stage and 54 (9.4%) patients with N1B stage. Symptomatic DPN was found in 89 (15.5%) patients with DM, including 46 (8.0%) patients with N2A stage and 43 (7.5%) patients with N2B stage, and disabling DPN (N3 stage) was found in 20 (3.5%) patients with DM. The control group comprised 50 healthy individuals (50 eyes). All patients underwent a routine eye examination including visual acuity and a dilated fundus examination. In addition, retinal and optic nerve OCT (RTVue–100, Optovue, Fremont, CA), was performed. We used the GCC protocol to explore parameters within a circle with a 6 mm diameter, and with the center of the GCC scan shifted 1 mm temporal to the fovea. The GCC scan makes a 6mm map, which is corresponding to about 20 degrees on the visual field map. Specifically, it is 10 degrees for superior and inferior directions, 7 degrees to nasal direction and 13 degrees to temporal direction. The parameters of GCC (average thickness, S-I [superior-inferior difference], FLV [focal loss volume, as the integral of deviation in areas of significant focal GCC loss], and GLV [global loss volume, as the sum of negative fractional deviation in the entire area]) were assessed. Means (M), standard deviations (σ), standard errors of the mean (SEM) were calculated using Microsoft Excell 2000. In addition, coefficients of variation (Сν), significance (p), 95% confidence intervals (CI) were calculated. Statistical analyses were performed using ANOVA. The level of significance p ≤ 0.05 was assumed. Results and Discussion The average GCC thickness was found to depend on the severity of DPN. Thus, in DM patients with N0 stage DPN, the mean average GCC thickness was 91.7±8.6 μm (range, 70.9 μm to 114.8 μm; 95% CI, 87.0 μm to 96.4 μm) (Table 1), compared to 87.8±9.5 μm (range, 66.8 μm to 121.8 μm; 95% CI, 82.7 μm to 92.9 μm), 87.6±9,9 μm (range, 66.2 μm to 126.5 μm; 95% CI, 82.2 μm to 93.0 μm), 99.9±10.8 μm (range, 80.1 μm to 155.0 μm; 95% CI, 94.1 μm to 105.7 μm), 98.3±11.1 μm (range, 77.6 μm to 160.3 μm; 95% CI, 92.3 μm to 104.3 μm), 85.3±10.7 μm (range, 61.7 μm to 136.5 μm; 95% CI, 79.5 μm to 91.1 μm), in those with N1A, N1B, N2A, N2B, and N3 stages DPN, respectively. Therefore, mean average GCC thicknesses in DM patients with N1A, N1B, and N3 stages DPN, were 8.4%, 8.6%, and 11.0%, respectively, lower than in controls (95.8 ± 8.2 μm) (p < 0.001).
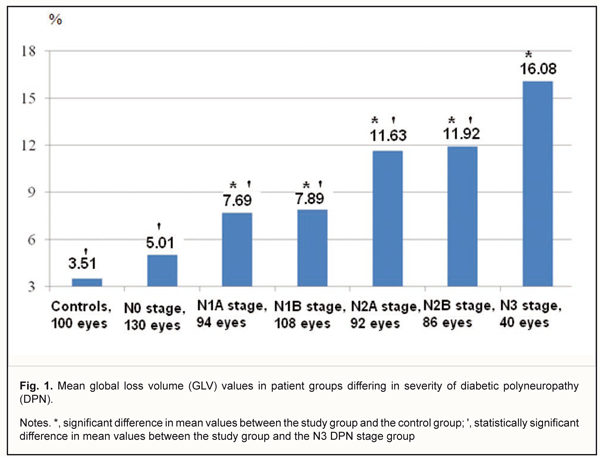
In DM patients with N0, N2A or N2B stages DPN, the mean average GCC thickness not significantly different from that in the control group (p > 0.05). The mean average GCC thickness was lowest in patients with N3 stage DPN, in which it was 17.1% and 15.2% lower than in patients with N2A or N2B stages DPN, respectively (p < 0.001). However, in DM patients with N0, N1A or N1B stages DPN, the mean GCC thickness not significantly different from that in patients with N3 stage DPN (p > 0.05). The superior GCC thickness was also found to depend on the severity of DPN. Thus, in DM patients with N0 stage DPN, the mean superior GCC thickness was 90.3±8.5 μm (range, 70.4 μm to 114.2 μm; 95% CI, 85.7 μm to 94.7 μm) (Table 1). Mean superior GCC thicknesses in DM patients N1A, N1B, and N3 stages DPN, were 10.0%, 10.5%, and 13.3%, respectively, lower, while in those with N2A and N2B, they were 9.4% and 8.7%, respectively, higher, than in controls (95.3 ± 7.9 μm) (p < 0.001). In DM patients with N0 stage DPN, the mean superior GCC thickness not significantly different from that in the control group (p > 0.05). The mean superior GCC thickness was lowest in patients with N3 stage DPN, in which it was 26.3%, 25.4% and 9.3% lower than in patients with N2A, N2B, and N0 stages DPN, respectively (p < 0.001). However, in DM patients with N1A or N1B stages DPN, the mean superior GCC thickness was not significantly different from that in patients with N3 stage DPN (p > 0.05). In DM patients without DPN, the mean inferior GCC thickness was 93.1±8.6 μm (range, 73.7 μm to 120.6 μm; 95% CI, 88.4 μm to 97.8 μm) (Table 1). Mean inferior GCC thicknesses in DM patients with N1A, N1B and N3 stages DPN were 6.7%, 6.7%, and 8.6%, respectively, lower than in controls (96.2 ± 8.4 μm) (p < 0.05). In DM patients with N0, N2A or N2B stage DPN, the mean inferior GCC thickness was not significantly different from that in the control group (p > 0.05). The mean inferior GCC thickness was lowest in patients with N3 stage DPN, in which it was 8.6% lower than in patients with N2A stage DPN (p < 0.05). However, in DM patients with N0, N1A, N1B or N2B stages DPN, the mean inferior GCC thickness was not significantly different from that in patients with N3 stage DPN (p > 0.05). The superior-inferior difference was also found to depend on the severity of DPN (Table 1). In DM patients with N1A, N1B or N3 stages DPN, mean superior–inferior differences in GCC thickness were 4.4, 5.1, and 5.9 times respectively, lower, while in those with N2A or N2B stages DPN, they were 11.8 and 14.0 times, respectively, higher than in controls (-0.9 ± 2.2, P < 0.001). The global loss volume was found to depend on the severity of DPN. Thus, in DM patients with N0 stage DPN, the GLV was 5.01±3.89 % (range, 0.04 % to 13.56%; 95% CI, 3.16% to 7.04%) (Fig 1), compared to 7.69±4.86% (range, 2.96% to 18.36%; 95% CI, 5.88% to 10.64%), 7.89±5.19% (range, 3.36% to 19.73%; 95% CI, 5.94% to 10.97%), 11.63±5.68% (range, 3.21% to 30.67%; 95% CI, 6.89% to 15.58%), 1.92±5.68% (range, 3.41% to 32.79%; 95% CI, 6.95% to 16.95%), 16.08±5.67% (range, 8.37% to 31.17%; 95% CI, 11.97% to 21.48%), in those with N1A, N1B, N2A, N2B, and N3 stages DPN, respectively. The mean GLV was highest in patients with N3 stage DPN, in which it was 68.6%, 52.2%, 50.9%, 27.7%, and 25.9% higher than in DM patients with N0, N1A, N1B, N2A or N2B stages DPN, respectively (p < 0.05).
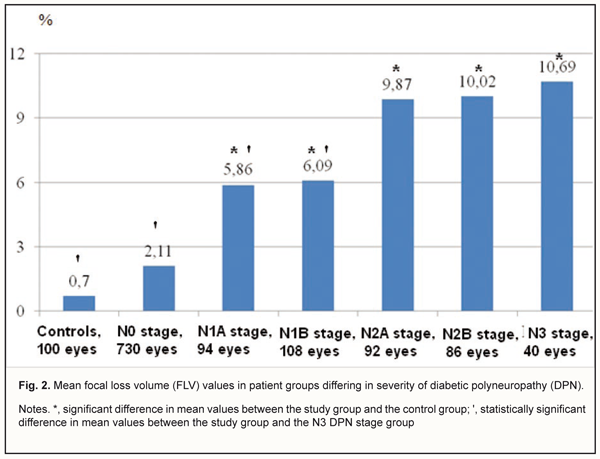
In DM patients with N0 stage DPN, the FLV was 2.11±1.79 % (range, 0.002 % to 4.85%; 95% CI, 1.17% to 3.38%) (Fig 2), compared to 5.86±2.37 % (range, 1.71 % to 11.07%; 95% CI, 3.65% to 7.98%), 6.09±2.49 % (range, 2.28 % to 13.39%; 95% CI, 3.74% to 8.16%), 9.87±3.78 % (range, 2.18 % to 29.85%; 95% CI, 6.44% to 12.89%), and 10.69±4.26% (range, 2.89 % to 21.29%; 95% CI, 5.73% to 15.05%), in those with N1A, N1B, N2A, N2B, and N3 stages DPN, respectively. The mean FLV was highest in patients with N3 stage DPN, in which it was 80.3%, 45.2%, and 43.0%, higher than in DM patients with N0, N1A and N1B stages DPN, respectively (p < 0.05).
Therefore, the data obtained suggest that there is an interrelationship between structural neuroretinal changes and severity of DPN. Studies in diabetic neuropathy have found that even a small increase in the levels of sorbitol and fructose in the neural tissue leads to increased hypoxia and activation of glycolysis processes resulting in demyelination of nerve fibers and axonopathy [16]. Increased sensitivity of the GCC to neurodegenerative changes in DM has been reported [11]. Our findings are in line with those of Ng and colleagues [12] who note that retinal ganglion cell neuronal damage in diabetes and DR can be clinically detected using OCT. In addition, these authors note that loss of GCC is present also in diabetic patients without retinopathy. Similar structural neurodegenerative changes (loss of ganglion cell bodies and reduction in thickness of the inner retinal layers) have been described by van Dijk and co-authors [7-8]. In a study by Pekel and colleagues [13], diabetic patients without retinopathy had thinner macular ganglion cell-inner plexiform layers (IPL) in the superior nasal macula when compared to healthy controls. Carpineto and co-authors [9] also demonstrated significantly reduced ganglion cell-IPL and RNFL thickness values in diabetic eyes without retinopathy, and the data of these authors confirmed that neuroretinal alterations are early in DM, preceding microvascular damages. Conclusion We found that the state of GCC in patients with DPN depends on the severity of the disease, and, in N1A, N1B, N2A, N2B and N3 stages DPN, mean FLV values were 8.4, 8.7, 14.1, 14.3, and 15.3 times, respectively, lower, whereas mean GLV values were 119.1%, 124.8%, 231.3%, 239.6%, and 358.1%, respectively, higher, than in age-matched healthy controls. References 1.Belova AN, Kudykin MN, Sheiko GE. [Diabetic peripheral neuropathy: epidemiology, pathogenesis, clinic diagnostics, treatment]. I.P. Pavlov Russian Medical Biological Herald. 2016; 24 (4):139–44. Russian. 2.Levin OS. [Diabetic polyneuropathy: current approaches to diagnosis and pathogenetic therapy]. Klinitsist. 2013;7(2):54–62. Russian. 3.Shahidi AM, Sampson GP, Pritchard N. Exploring retinal and functional markers of diabetic neuropathy. Clin Exp Optom. 2010 Sep;93(5):309-23. 4.Srinivasan S, Dehghani C, Pritchard N, Edwards K, Russell AW, et al. Optical coherence tomography predicts 4-year incident diabetic neuropathy. Ophthalmic Physiol Opt. 2017 Jul;37(4):451-9. 5.Zhang L, Inoue M, Dong K, Yamamoto M. Retrograde axonal transport impairment of large- and medium-sized retinal ganglion cells in diabetic rat. Curr Eye Res. 2000 Feb;20(2):131-6. 6.Barber AJ. Diabetic retinopathy: recent advances towards understanding neurodegeneration and vision loss. Sci China Life Sci. 2015 Jun;58(6):541-9 7.van Dijk HW, Kok PH, Garvin M, Sonka M, Devries JH, Michels RP, et al. Selective loss of inner retinal layer thickness in type 1 diabetic patients with minimal diabetic retinopathy. Invest Ophthalmol Vis Sci. 2009 Jul;50(7):3404-9. 8.van Dijk HW, Verbraak FD, Kok PHB, Early neurodegeneration in the retina of type 2 diabetic patients. Invest Ophthalmol Vis Sci. 2012 May 14;53(6):2715-9. 9.Carpineto P, Toto L, Aloia R, Ciciarelli V, Borrelli E, Vitacolonna E, et al. Neuroretinal alterations in the early stages of diabetic retinopathy in patients with type 2 diabetes mellitus. Eye (Lond). 2016 May;30(5):673-9. 10.El-Fayoumi D, Badr Eldine NM, Esmael AF, Ghalwash D, Soliman HM. Retinal Nerve Fiber Layer and Ganglion Cell Complex Thicknesses Are Reduced in Children With Type 1 Diabetes With No Evidence of Vascular Retinopathy. Invest Ophthalmol Vis Sci. 2016 Oct 1;57(13):5355-5360. 11.Kern TS, Barber AJ. Retinal ganglion cells in diabetes. J Physiol. 2008 Sep 15;586(18):4401-8. 12.Ng DS, Chiang PP, Tan G, Cheung CG, Cheng CY et al. Retinal ganglion cell neuronal damage in diabetes and diabetic retinopathy. Clin Exp Ophthalmol. 2016 May;44(4):243-50. 13.Pekel E, Tufaner G, Kaya H, Kaşıkçı A, Deda G, Pekel G. Assessment of optic disc and ganglion cell layer in diabetes mellitus type 2. Medicine (Baltimore). 2017 Jul;96(29):e7556. 14.Rodrigues E, Urias MG, Penha FM, Badaró E, Meirelles R, et al. Diabetes induces changes in neuroretina before retinal vessels: a spectral-domain optical coherence tomography study. Int J Retina Vitreous. 2015 Apr 15;1:4. 15.Simo R, Hernandez C; European Consortium for the Early Treatment of Diabetic Retinopathy (EUROCONDOR). Neurodegeneration in the diabetic eye: new insights and therapeutic perspectives. Trends Endocrinol Metab. 2014 Jan;25(1):23-33. 16.Kotov SV, Kalinin AP, Rudakova IG. Diabetic neuropathy. Moscow: Medical information agency; 2011. Russian. 17.Boulton AJ. Diabetic neuropathy: classification, measurement and treatment. Curr Opin Endocrinol Diabetes Obes. 2007 Apr;14(2):141-5.
|