J.ophthalmol.(Ukraine).2018;3:85-97.
|
https://doi.org/10.31288/oftalmolzh201838597 Substantiating the potential for a new technique (impedance oculopneumoplethysmography) to assist in diagnosing microvascular ciliary body ischemia O.G. Kovalchuk, Cand Sc (Med) Filatov Institute of Eye Diseases and Tissue Therapy; Odessa (Ukraine) E-mail: alkov7@gmail.com TO CITE THIS ARTICLE: Kovalchuk OG. Substantiating the potential for a new technique (impedance oculopneumoplethysmography) to assist in diagnosing microvascular ciliary body ischemia. J.ophthalmol.(Ukraine).2018;3:85-97. https://doi.org/10.31288/oftalmolzh201838597
Purpose: To provide theoretical substantiation of the potential for a new technique, impedance oculopneumoplethysmography (OPPG), to assist in diagnosing microvascular ciliary body ischemia. Methods: Modeling the distribution of high-frequency current in ocular tissues during ocular rheography; modeling the conversion of the local short-term vacuum compression of the globe to the increase in intraocular pressure (IOP); estimating the height of scleral deflection averaged over the site of local vacuum compression based on the IOP rise. Results: A new method for estimating the state of intraocular circulation, impedance OPPG, was proposed, and its potential to assist in diagnosing microvascular ciliary body ischemia by identifying low (< 35.0 mm Hg) diastolic ocular perfusion pressure (OPP) in the ciliary body metarterioles was theoretically substantiated. The diastolic OPP corresponds to the “local short-term vacuum compression” induced IOP rise at which a decrease in the pulsatile blood volume amplitude is registered by ocular rheography. With this method used as per the utility model (i.e., with a ring-shaped suction cup (RSCP) applied perilimbally, and with rheography electrodes, as per Pat. UA 112192), the diastolic perfusion pressure is estimated only in the arterioles of the ciliary body microcirculation system. Using a mathematical model, a formula K×(VAC/D4) was derived for estimating the increase in IOP based on the vacuum pressure applied, VAC, and globe diameter, D, with the factor K depending on the dimensions of the specific RSCP. Conclusion: The approach proposed for estimating the OPP in the metarterioles may be useful for early diagnosis of impaired vascular microcirculation in eyes with glaucoma (including low-tension glaucoma), myopia, diabetic angiopathy, peripheral retinal degeneration, age-related macular degeneration, or uveitis, and may enable estimating the efficiency of treatment for these disorders after conservative therapy or surgical procedures. Keywords: impedance oculopneumoplethysmography, ocular perfusion pressure, microvascular ciliary body ischemia, modeling the increase in intraocular pressure, local vacuum compression of the globe, ocular rheography
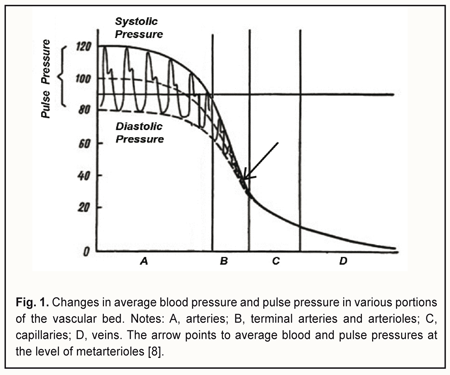
Introduction The course and outcome of an eye disease depend largely on the degree of impairment in ocular circulation. Blood flow through the eye (ocular blood flow) depends on perfusion pressure (PP) in the intraocular vessels, which in turn depends on 1) the systemic arterial blood pressure (BP) and 2) vascular resistance of the intraocular blood vessels and intraocular pressure (IOP). Perfusion pressure is the difference between the blood pressure in the supplying arterial vessels and the local tissue pressure and characterizes the rate of metabolic exchange between blood and tissues [1]. The concept of perfusion pressure has only a meaning when it is applied with regard to a microvascular network comprising of 5- to 30-μm capillaries and ≤100-μm arterioles and venules, since an actual metabolic exchange between blood and tissues can only take place in a system of this kind. In the 1970s, the “microcirculatory (or miscovascular) ischemia” term was introduced to define myocardial ischemia in patients with angina pectoris in the absence of angiographic evidence of lesions in major coronary vessels [2]. Subsequently, it has been found that this type of ischemia results from microvascular dysfunction that leads to an impairment of blood flow in the microvascular bed of the myocardium. The ocular blood supply system is arranged in such a way that the large vessels enter the globe posteriously and gradually get narrower (with a decrease in pressure in them) as they go anteriorly. The vascular system of the ciliary body is comprised of eleven small arteries less than 100 μm in diameter [3], including seven anterior ciliary arteries from rectus muscles (two from each rectus muscle except lateral rectus, which supplies only one of the anterior ciliary arteries) and four from two long posterior ciliary arteries, each of the latter being divided into two branches before entering the ciliary body. Just for comparison, diameters of the central retinal artery and ophthalmic artery have been reported to be 163.0±17.0 μm [4] and 1.14±0.26 mm [5], respectively. Since the vascular system of the ciliary body is the only portion of the uvea that comprises just capillaries and small vessels less than 100 μm in diameter, it is a convenient object for investigation of vascular microcirculation of the eye. It has been reported that the 30-100-μm terminal arteries and arterioles (the resistance vessels) and 5-30-μm capillaries (the exchange vessels) account for about 70% of the total resistance to flow in the human vascular system, whereas other arteries and veins account for 20% and 10%, respectively [1, 6, 7]. Arterioles, however, account for the major portion of the total resistance to blood flow, which is evidenced by the fact that the pressure gradient along a short portion (1-2 mm) of the arteriole is 30-40 mmHg. Sechenov called arterioles the “valves of the cardiovascular system”. Opening the “valves” increases the blood flow to the capillaries of the respective region, increases pressure in the capillaries, and enhances tissue blood supply, whereas closing the valves hampers the blood circulation in the respective vascular microcirculation region. Since the functional load of arterioles is rather high, they are a potential site of 1) initial impairment of lumen regulation and/or 2) mild pathological changes in the coats, which can result in a substantial increase in resistance to blood flow with subsequent reduced perfusion pressure in capillaries and tissue ischemia with development of dystrophic tissue changes and dysfunction. Therefore, a search for new methods for determining ocular perfusion pressure (OPP) at the level of the microvascular bed – the most sensitive methods for diagnosing ocular tissue ischemia – is deemed to be important. The difference between systolic and diastolic pressure in the precapillaries (or metarterioles) is very small, with the arterial pressure a little variable around an average of 40 mmHg (Fig. 1). Arterial pressure pulse waves are absent in capillaries, with average blood pressure values at the arterial and venous capillary ends being 30-35 mmH and 15 mmHg, respectively. At the arteriolar portion (Fig. 1), blood pressure decreases abruptly, and pulse pressure reduces to zero, whereas at the metarteriolic portion, the diastolic pressure is close to (slightly above) the blood pressure at the arterial capillary end. This allows for diagnosing microcirculatory (or microvascular) ischemia in the tissue by a reduction in the diastolic perfusion pressure in the arterioles that supply blood to the tissue.
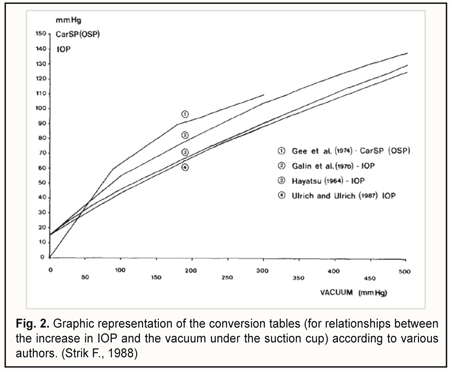
In 1966, Lobstein and Herr [9] proposed to determine OPP as the difference between (1) the mean ophthalmic artery pressure considered as two thirds of mean brachial artery blood pressure and (2) intraocular pressure (IOP). They also considered systolic OPP and diastolic OPP to be important. Subsequently, others made the OPP formula more precise by taking into account additional hemodynamic characteristics of the vascular system [10, 11]. All the calculation methods for determining OPP are based on the use of blood pressure in the brachial artery, with the OPP determined at the level of the ophthalmic artery or central retinal artery [12], and with the OPP being actually transmural pressure for these arteries. Such an approach does not allow for an estimation of the state of intraocular vascular microcirculation. In 2007, Balalin et al [13] reported on the determination of the OPP in the anterior eye by contact vasotonometry in the anterior ciliary arteries (ACA), with registration of the onset and disappearance of pulsations in the arteries during their compression by the optical lens. Perfusion pressure was calculated using the following formula: Pp = Pcil - Pio, where Pp is OPP in the anterior eye, Pcil is mean pressure in the ACA, and Pio is IOP. In 2011, Fokin and co-authors [14] reported on developing an advanced vasotonometer with incorporated optical prism which can be used to apply local compression to the ACA. They also used the above formula for estimating the perfusion pressure in the anterior eye. In addition, in an attempt to prove the usefulness of the vasotonometer, it was used for examining a patient with initial unilateral primary open-angle glaucoma. Those authors found the OPP in the anterior segment of the non-affected and affected eyes to be 34 mmHg and 21.2 mmHg, respectively. After topical treatment with travatan (travoprost) 0.004%, the OPP in the anterior segment of the glaucomatous eye increased to 29.9 mmHg. In 2007, Gndoyan and co-authors [15] developed a computerized vasotonometer for measuring the blood pressure in the ACA. Digital processing of the signal from the electromechanical pressure transducer for automatic registration of arterial pressure is the feature that differs this vasotonometer from that with incorporated optical prism. The main disadvantages of contact vasotonometry in the ACA are as follows: the method 1) does not examine the state of intraocular circulation, 2) requires high accuracy in movements from the operator (compression of the vessel with the vasotonometer is performed manually), and 3) is local since only one ACA undergoes examination. In 1985, Ulrich and Ulrich [16] developed oculo-oscillo-dynamography (OODG-Ulrich) for determining the OPP in the central retinal artery, ciliary arteries and the choroid. The method involves bilateral continuous registration by infrasound pressure transducers of a reduction in pulse wave amplitude caused by changes in blood volume in the intraocular vessels while the IOP is raised by local vacuum compression of the globe. OODG-Ulrich can be seen as an extension of the method proposed earlier by Gee and co-authors [17] for diagnosing stenosis of the carotid artery. Since OODG only takes 40 seconds to perform, it can be used in a screening setting. Initially, the calibration curve by Hayatsu was used to determine the rise in IOP from the suction cup negative pressure, but subsequently, the authors changed over to calibration curves of their own (Fig. 2) [18].
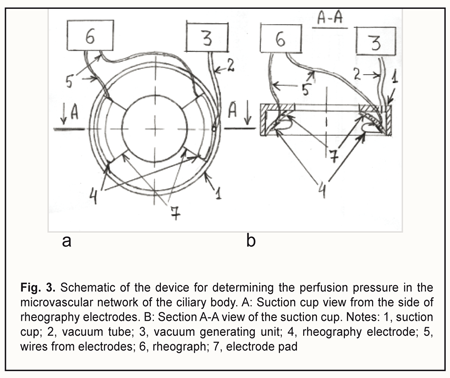
The OODG-Ulrich method, to my mind, has four major disadvantages. First, it does not allow locating the source of the pulse wave topographically, since all the vessels supplying the eye with blood do influence the pulse wave. Second, it does not allow separating the oscillations of ≤100-μm vessels and determining the perfusion pressure in these vessels, since the oscillations of large vessels 1) are the major contributor to the pulse wave registered by the method and 2) are propagated from the posterior pole of the eye throughout the eye without attenuation due to their low frequency. It is known that the pulse wave power is proportional to the squared pulse wave amplitude. Assuming that the amplitude of vessel wall oscillations is proportional to the vessel diameter, it can be shown that the power of oscillations from the > 1-mm ophthalmic artery will be 100 times greater than that from a ≤100-μm vessel of the microvascular bed. Third, Ernest et al [19] used the OODG-Ulrich method in a study including 40 eyes, and found that the slope of the linear regression curve for IOP change with suction cup negative pressures from -300 to -100 mm Hg varied rather widely, from 0.148 to 0.318 (average, 0.248; SD=0.041), although the linear correlation coefficient was high (r > 0.96; p<0.02) in all the cases. The accuracy of perfusion pressure calculations based on the calibration curves is low due to a rather large (> 68%) relative range of variation for the slope. The authors noted that, at suction cup negative pressures greater than —300 mm Hg, or less than —100 mm Hg, the linear relationship between the IOP and suction cup negative pressure no longer existed. Finally, when the OODG-Ulrich is performed, the IOP increases, causing a decrease in aqueous humor production due to an ultrafiltration mechanism, and a substantial increase in aqueous humor outflow through the trabecular and uveoscleral pathways. Consequently, as the IOP increases, the globe volume decreases. This determines non-linearity of the relationship between the IOP increase and suction cup negative pressure. Previously, we have developed a device for determining the perfusion pressure in the microvascular network of the ciliary body [20]. Figure 3 shows the schematic of the device.
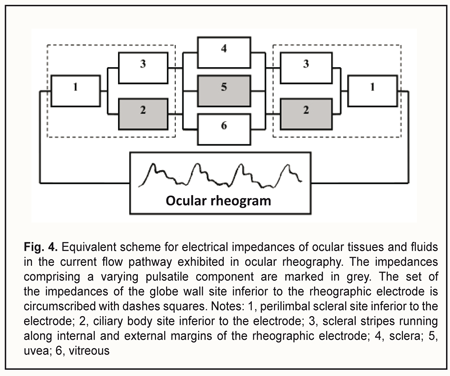
The device is composed of a suction cup (1), a vacuum generating unit (3), and a rheograph (6). The suction cup is designed as an L-shaped vacuum compression ring with a cylindrical side surface located at a right angle to a flat anterior surface. In addition, the internal and external diameters of the ring are 12 mm and 20 mm, respectively. Furthermore, the ratio of the width of the anterior surface to the width of the side surface is such that, with the suction cup placed on the anterior eye, the internal margin of the ring will contact the eye at the limbus, whereas the external margin will contact the eye at the sclera, 5-6 mm from the limbus. The two rheography electrodes are installed opposite each other, on the pad that is positioned between the external and internal margins of the ring and is bent with a radius of 12.7 mm, to fit an average scleral curvature in the perilimbal area. The electrodes are connected to the rheograph by flexible wires. The vacuum tube leaves the ring at the junction of its anterior and side surfaces to connect the gap located above one of the electrodes (between the pad and L-shaped profile of the ring) with the vacuum generating unit. The proposed utility model aims to improve the OODG method for determining the ocular perfusion pressure by using a special device for non-invasive measuring of the perfusion pressure in the microvascular network of the ciliary body. This approach allows measuring the diastolic perfusion pressure in the metarterioles of the network, and, should it be lower than 35 mmHg, diagnosing microcirculatory ischemia of the ciliary body and monitoring the efficacy of treatment for this ischemia. The normal value for the diastolic ocular perfusion pressure (35 mm Hg) is based on the findings pertaining to the use of the vasotonometer [15] in the clinical setting, and is in agreement with average perfusion pressure values of 30-35 mm Hg at the arterial capillary ends in normal eyes. The population-based studies conducted in different countries from 1995 to 2010 [21-26] found that low perfusion pressure and low diastolic pressure were associated with increased prevalence of open-angle glaucoma (OAG), and confirmed the significance of low perfusion pressures in the pathogenesis of glaucoma. Primary and secondary insults are regarded as the main mechanisms of glaucoma damage in eyes with low OPP [27]. The primary insult develops at the optic nerve head as a result of ischemia in eyes with low OPP, with modulating factors being the biomechanical properties of the tissues and cerebrospinal fluid pressure. The secondary insult develops in the retina due to impaired autoregulation or neurovascular coupling. Autoregulation is the ability of a vascular bed to maintain its blood flow despite changes in perfusion pressure. Blood flow increases when neurons get active, a response called functional hyperemia (or neurovascular coupling). It is believed that a failure of both processes, autoregulation and neurovascular coupling, occur, if the perfusion pressure falls below the critical level. The objective to improve the OODG method is met in the following way. The method for diagnosing microcirculatory ciliary body ischemia consists in determining the perfusion pressure in the intraocular arterial vessels by the level of the vacuum applied to the globe at which ocular pulses show a change in the amplitude. With this method used as per the utility model (i.e., with a suction cup designed as an L-shaped ring and applied perilimbally, and with rheography electrodes on pads opposite each other), the diastolic perfusion pressure is measured by ocular rheography, and only in the arterioles of the microvascular network of the ciliary body, with no influence of the superficial subconjunctival vessels of the anterior eye or intraocular vessels of the posterior segment on the results of blood circulation study. In addition, the perfusion pressure in the smaller vessels of the anterior eye is determined at a less raised IOP, with a short-term decrease in aqueous production matched by a proportional decrease in aqueous outflow, ensuring the maintenance of eye globe volume during the examination period. Furthermore, the perfusion pressure is calculated using the formula K• , where VAC is the vacuum pressure applied, D is the globe diameter and K is the factor that depends on the specific dimensions of the ring-shaped suction cup. The necessary claims related to the approach to meeting the objective above are as follows. Claim 1 is that perfusion pressure is measured only in the microvascular network of the ciliary body, with no influence of the superficial subconjunctival vessels of the anterior eye or posterior segment vessels on the results of blood circulation study. The superficial subconjunctival vessels are not involved in the formation of eye rheogram during the examination period since they are pressed upon by the external margin of the ring-shaped suction cup, which allows perfusion pressure to be examined in the intraocular vessels only. The suction cup designed as an L-shaped ring with rheography electrodes installed upon the ring pad allows for positioning the electrodes at the perilimbal scleral sites located precisely above the ciliary body and symmetrically with respect to the cornea. With the electrodes positioned in this way, the pathway for propagation of a high frequency probe current through the globe may be replaced by the equivalent circuit comprising the impedances of ocular tissues and fluids connected in series and/or in parallel (Fig. 4). Inferior to each of the electrodes, the current flows sequentially through perilimbal scleral sites and underlying cliary body sites. In addition, pulsatile changes in ciliary body blood volume cause synchronous fluctuations in ciliary body impedance that is shunted by constant resistance of the scleral stripes running along internal and external margins of the arcuate rheographic electrode. The total cross-section of the stripes equals the perilimbal scleral thickness multiplied by the length of the electrode, whereas the stripe length equals the ciliary body thickness. The current further runs between ciliary body sites located under the electrodes by the three parallel pathways, throughout the area of the sclera and uvea (from the ciliary body to the posterior pole), and throughout the vitreous. In addition, pulsatile changes in uveal blood volume cause synchronous fluctuations in uveal impedance that is shunted by constant resistances of the vitreous and sclera.
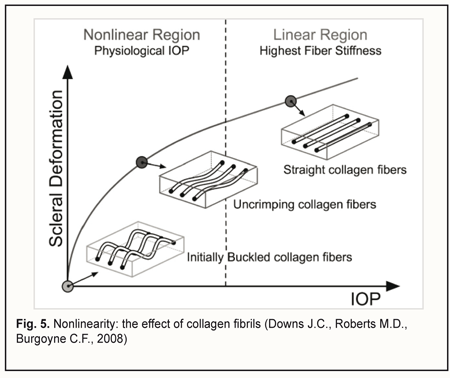
Let us examine the equivalent scheme of electrical impedances of the ciliary body, sclera, uvea and vitreous for ocular rheography, and estimate separately the contributions of impedance pulsations of the ciliary body and uvea to the pulsations of the total impedance across rheography electrodes. The specific conductivity of the vitreous (1.55 S/m) is twice as high as that of blood 0.66 S/m) or sclera (0.62 S/m) [28]. Since the specific conductivity of the retrobulbar fat is two orders of magnitude lower than that for the vitreous, the current running through the fat is likely to be negligible. It has been reported that uveal thickness is 0.2-0.4 mm (mean, 0.3 mm), whereas scleral thickness, pars plicata thickness and scleral thickness above the ciliary body are 0.3-0.8 mm (mean, 0.6 mm), 0.6 mm, and up to 0.6 mm, respectively [3]. The width and length of a typical arcuate rheography electrode are 3 mm and about 13 mm, respectively. The conductivity of tissues across electrode pair is directly proportional to their specific conductivity and cross-sectional area and inversely proportional to the distance between electrodes: G=σ·S/l where G is conductivity of tissues across electrode pair, σ is specific conductivity, S is the cross-sectional area of the tissue through which the current passes, and l is the distance between electrodes. With the impedances of (1) the ciliary body and (2) scleral stripes running along internal and external margins of the arcuate rheographic electrode connected in parallel, the ratio of their conductivities will be determined by the formula above, i.e., with each of these conductivities being directly proportional to the specific conductivity and cross-sectional area and inversely proportional to the distance between the electrode and the vitreous (and these distances are of 0.6 mm both for the ciliary body and perilimbal sclera). The cross-sectional area of the 6-mm perilimbal scleral site running along the internal and external margins of the 13-mm rheographic electrode will be 2•13•0.6=15.6 (mm2). The cross-sectional area of the ciliary body site underneath the rheographic electrode (width, 3 mm; length, 13 mm) will be 13•3=39 (mm2). Therefore, the ratio of the conductivities of (1) the ciliary body site underneath the rheographic electrode and (2) scleral stripes running along internal and external margins of the arcuate rheographic electrode will be 39*0.66/15.6*0.62=2.7. Thus, the electrical conductivity of the scleral stripes shunting the impedance of the ciliary body will be 2.7 times lower than that of the ciliary body site. It is estimated that due to shunting the impedance of the ciliary body by that of the scleral stripes, the pulsation percentage for the former impedance will decrease to 2.7/1+2.7*100=73% With the impedances of the sclera, uvea and vitreous connected in parallel, the ratio of the electrical conductivity of the uvea to the total conductivity of the vitreous and sclera across the electrodes will be determined by the ratio of the products of their specific conductivities and averaged cross-section areas divided by their lengths. In order to simplify the calculation, let us consider maximum cross-sectional areas of the sclera, uvea and vitreous in the plane passing through the center of the eye, since the change in the cross-sectional area across the electrodes for the sclera is proportional to that for the uvea or the vitreous. We will take into account that the vitreous width across the electrodes in the plane passing through both the center of the eye and the electrodes, is π/2 (approximately, 1.5) times less than the length of the sclera and uvea. Given an average axial length of 24 mm, the maximum cross-sectional area of the vitreous will be π*D2/4 = 3.14*242/4 = 452.4 (mm2). The cross-sectional area of the uvea will be the difference in area between 24.0-mm and 24.3-mm circles, that is, 463.8 – 452.4=11.4 (mm2). The cross-sectional area of the sclera will be the difference in area between 24.3-mm and 24.9-mm circles, that is, 486.7 – 463.8=22.9 (mm2). The ratio of the total electric conductivity of the vitreous and sclera to the electric conductivity of the uvea will be (452.4*1.55*1.5)+(22.9*0.62*1)/11.4*0.66*1 = 142 Therefore, the total impedance of the vitreous and sclera shunts the impedance of the uvea, and the total conductivity of the two former is about 140 times as high as the conductivity of the latter. It is estimated that due to shunting the impedance of the uvea by low impedance of the vitreous and sclera, the pulsation percentage for the former impedance will decrease to 1/1.42 *100 = 0.7% We examined the equivalent scheme for electrical impedances of the ciliary body, sclera, uvea and vitreous in the current flow pathway exhibited in ocular rheography. This examination demonstrated that the influence of a very small pulsatile component (0.1-0.5% from the constant component of the impedance across rheography electrodes) of the total ciliary body impedance (that is connected in series with the vitreous impedance) on the amplitude of pulsations of the total impedance across rheography electrodes is two orders of magnitude greater than that produced by pulsations of the uveaal impedance that is shunted by low vitreous and scleral impedances. This is in agreement with the report of Katznelson [29] who found that, in ocular rheography, the current applied flowed mainly through the ciliary body. Since there are no pulsatile components in blood volumes in the capillaries and venules of the human vascular system, and the vascular system of the ciliary body is composed of only arterioles, venules and a meshwork of capillaries that connect them, the pulsatile component in impedance waveform on the eye rheogram could result only from pulsatile changes in blood volume in the arterioles of the the microvascular network of the ciliary body. According to the Starling resistor model, with an increase in IOP, blood will be displaced, first of all, from the precapillaries (or metarterioles) with a low arterial pressure, and, consequently, it is an increase in IOP to the level of diastolic perfusion pressure in metarterioles that will cause an initial decrease in magnitude of eye rheogram pulsation. Claim 2 is improved study safety which influences the technical performance of the method. The arterial pressure in small vessels of the anterior eye is significantly lower than in larger vessels of the posterior eye, and, consequently, with an increase in IOP, blood will be displaced, first of all, from the former vessels. However, the blood flow will not cease completely even in these vessels since the examination is performed with the IOP raised only to a level at which the diastolic perfusion pressure in the arterioles can be determined. Consequently, an examination conducted at the less raised IOP will not result in the cessation of the circulation in central retinal artery and its branches, which reduces chances for thrombosis or vitreal hemorrhage. Claim 3 is that a level of vacuum compression is matched by a proportional decrease in aqueous production and aqueous outflow, with maintenance of globe volume, which provides a linear conversion of the vacuum applied to the increase in IOP for a vacuum higher than 300 mmHg. In the method proposed, the aqueous veins become pressed upon due to mechanical deformation of the perilimbal sclera by external and internal margins of the ring-shaped suction cup, which contributes 80-90% to the reduction in aqueous outflow through the trabecular meshwork, whereas the increase in IOP causes a significant ultrafiltration-induced reduction in aqueous production. The non-linearity of the relationship between the vacuum applied and the increase in IOP for a vacuum level below 100 mm Hg could be attributed to the fact that crimped scleral collagen fibers progressively straighten [30] with the transition from an initially compliant, nonlinear response to a stiffened linear response as IOP increases (Fig. 5).
This nonlinearity does not influence the study accuracy, since at a vacuum level below 100 mm Hg, an increase in IOP is too low for achieving the diastolic ocular perfusion pressure. Claim 4 is taking into account the size of the eye when converting the short-term local vacuum compression to the increase in IOP. Chen and co-authors [31] presented a mathematical analysis of ocular pneumoplethysmography, based on the physiological, anatomical, and biomechanical properties of the eye, and obtained a quantitative relationship between increase in intraocular pressure and applied vacuum. They concluded that that the relationship between the IOP increase and the level of applied vacuum was independent of the Young's modulus of the sclera, and depended primarily on the ratio of the diameter of the vacuum cup to the diameter of the eye. Given a great variability (> 68%) in the slopes of the linear regression curve for IOP increase versus suction cup pressures between different eyes [20], one may hypothesize that the relationship between IOP increase and vacuum pressure applied to the globe might be influenced by the size of the eye (or axial length), the parameter that for some reason has been not accounted for in previous studies by others on OODG.
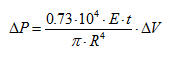
Lyubimov [32] developed a model of the eye as a thin, spherical shell with biomechanical parameters of the human eye, for which he presented a formula demonstrating the relationship between an additional volume of fluid introduced into the sphere (i.e., an increase in the volume of fluid inside the sphere) and an increase in the pressure inside the sphere:
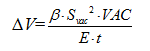
where ∆P is the increase in pressure (above atmospheric) inside the sphere expressed in mm Hg; E is the Young's modulus for the shell material expressed in megapascales (10-15 MPa); t is the thickness of the spherical shell expressed in millimeters (0.5-1.0 mm); ∆V is the increase in the volume of fluid inside the sphere expressed in cubic millimeters (10-100 mm3), R is the radius of the spherical shell expressed in millimeters. The mechanism of the increase in IOP after injection of a specified volume of fluid into the eye is different from that after local vacuum compression of the sclera. In the former mechanism, the increase in IOP is due to the increase in the volume of the intraocular fluid, with a slight increase in the radius and maintenance of the spherical shape of the shell. In the latter mechanism, the increase in IOP is due to slight local changes in the shape of the spherical shell, with maintenance of the volume of the intraocular fluid. Displacement of a small volume of fluid under a scleral site that has been deformed by vacuum can be considered as addition of a displaced volume of fluid to the total eye volume with a slight increase in eye radius in a uniform omnidirectional pattern, provided that an increase in the IOP does not result in change in the shape of the eye outside the site of local compression by vacuum, and, consequently, formula (1) can be used to determine the relationship between an increase in the IOP and level of local vacuum compression. In a way similar to the injection of an additional volume of fluid into the spherical shell, the influence of vacuum on a local site of the sclera will be spread all over the sclera due to sliding of smooth margins of the ring-shaped suction cup on the conjunctiva, and with a free displacement of the underlying sclera (that, to a first approximation, is a soft shell, if considered in the thickness direction) under the ring. Therefore, obviously, ∆V, the volume of displaced fluid, equals Svac, the area of the site of local vacuum compression, multiplied by f̅, the height of scleral deflection averaged over the entire area of the site:
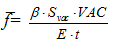
The height of scleral deflection averaged over the entire area of the site of local vacuum compression (f̅) is proportional to Svac, the area of the site, and VAC, the level of applied vacuum, and inversely proportional to the Young's modulus E and scleral thickness t (with increased values of the two latter parameters, vacuum causes less deformation in a stiffer scleral shell). The β coefficient takes into consideration the efficacy of scleral deflection depending on the shape of the site of local vacuum compression.
Formula (3) is a special case of Hooke’s law, the basic law of elasticity, which reflects a linear relationship between the applied stress and small strains (or deformations) in an elastic medium. The deformation at the site of local vacuum compression may be regarded as small, because the maximum volume of displaced fluid (100 mm3) in a 24-mm eye will be less than 1.4% of the eye volume. Hooke’s law gives the following formula for the deformation of elastic nail as a function of the applied force:
where ∆l is the absolute elongation or length decrease, F is the deformation force applied to the nail, k is the elastic coefficient Let us compare formulas (3) and (4). The height of scleral deflection averaged over the entire area of the site of local vacuum compression (f̅) in formula (3) corresponds to ∆l, the linear deformation; the expression Svac·VAC in the numerator corresponds to F, the force of vacuum applied to the site of local vacuum compression, and the expression E·t in the denominator corresponds to the elastic (stiffness) coefficient for a thin, spherical shell filled with fluid. The β coefficient in formula (3) accounts for the fact that the deformable elastic body represents the spherical elastic, transversely isotropic shell, the deflection height of which at the site of local vacuum compression is determined, all things being equal, by the shape of the site (the most effective shape is round). For example, the average slope of the IOP change with suction cup negative pressures from -300 to -100 mmHg for the suction cup with an inside diameter of 13 mm was found to be 0.248 [19]. A 50 mmHg IOP rise (from 15 mm Hg to 65 mm Hg) with the ring-shaped suction cup (internal diameter, 12 mm; external diameter, 20 mm) in laser in situ keratomileusis (LASIK) requires a vacuum of at least 500 mm Hg. Under these conditions, the slope of the IOP change against the applied vacuum will be about 0.1, and the area of compression under the hemispherical suction cup will be 1.5 times less than that under the ring-shaped suction cup (143.3 mm² versus 218.5 mm²).
We can express ∆V, the volume of displaced fluid, in another way, by replacing f̅, the height of scleral deflection in formula (2), with the equivalent expression from formula (3):
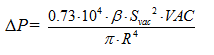
By replacing ∆V in formula (1) with the equivalent expression from formula (5), and cancelling the variables that are present both in the numerator and denominator, we will obtain the new formula for the ∆P:
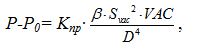
By replacing ∆P and the radius of the eye, R, with the difference between current and baseline intraocular pressure, PP0, and the half of the diameter of the eye, D/2, respectively, and introducing all the constants in a single proportionality factor Kpr (for convenience) in formula (6), we will obtain the formula for the relationship between the level of applied vacuum VAC and the rise in IOP:
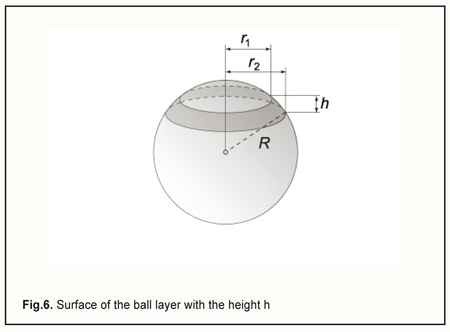
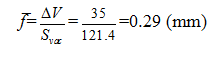
where P is the current IOP level during local vacuum compression of the globe (mm Hg), P0 is the baseline IOP level before local vacuum compression of the globe (mm Hg), Kpr is the proportionality factor, β is the coefficient that takes into consideration the efficacy of scleral deflection depending on the shape of the site of local vacuum compression, Svac is the area of the site of local vacuum compression, VAC is the level of applied vacuum (mm Hg), Dis the diameter (or axial length) of the eye (mm). The formula (7) obtained is an agreement with the findings of Chen and co-authors [31] who found that the relationship between IOP increase and applied vacuum was independent of the Young's modulus of the sclera, and depended primarily on the ratio of the diameter of the vacuum cup to the diameter of the eye. We, however, found that the relationship was also independent of the scleral thickness. Lyubimov [32] used formula (1) and found that with injection of an additional volume of fluid ∆V of 10 mm to 100 mm3 into the 12-mm radius spherical shell, the excessive pressure inside the shell increased linearly from 10 mm Hg to 100 mm Hg. Let us estimate the height of scleral deflection (averaged over the entire area of the site of local vacuum compression) f̅ with a 35 mm Hg rise in IOP. The rise in IOP is needed to achieve the diastolic perfusion pressure in the metarterioles, which is observed under normal physiological conditions. According to the calculations above, this requires the injection (in our case, the displacement) of additional 35 mm3 of fluid into the eye. First, let us determine the scleral area subjected to vacuum through the parts of the above positioned ring-shaped suction cup which are covered with electrode pads, for an eye with the radius of 12 mm. The area of the perilimbal scleral site under the ring-shaped suction cup corresponds to the external surface of the ball layer with the height h (Fig. 6) and is calculated using the formula: S=2πR·h.
In the case of the ring-shaped suction cup as per the patent for the utility model [20], the height h is 2.9 mm, and thus the area of the perilimbal scleral site under the ring will be 2π·12.0·2.9=218.5 (mm2). In addition, the two arcuate rheography electrodes are installed opposite each other (on the pads), with each of them occupying a sector of 80 degrees in the ring. Therefore, the two sectors (of 100 degrees each) positioned between the pads can be subjected to vacuum compression, and, consequently, the total area of the site of vacuum compression, Svac, will be 218.5*2*100/360=121.4 (mm2).
Finally, formula (2) can be used to calculate the height of scleral deflection (averaged over the entire area of the site) f̅ required for a 35 mm Hg increase in IOP.
In the case of the ring-shaped suction cup as per the patent for the utility model [20], the maximum spacing between the ring-shaped suction cup and perilimbal scleral surface is about 2.2 mm, whereas the half of the distance between the internal and external margins of the ring is about 2.5 mm. These are substantially greater than the height of scleral deflection (averaged over the entire area of the site of local vacuum compression), which makes a technical background for performing vacuum-induced compression with the achievement of the maximum possible diastolic OPP of 35 mm Hg (this pressure level is characteristic for physiologically normal conditions).
When considering cases with suction cups of the same shape and dimensions, the product term β·Svac2 in the numerator of formula (7) can be introduced in the proportionality factor Kpr because it will have a constant value, and thus the formula can be re-expressed as follows:
The proportionality factor Kpr for the specific ring-shaped suction cup and eyes with different axial lengths is calculated as the slope of the linear regression curve for IOP increase vs vacuum applied divided by eye diameter raised to the power 4. The body of data should involve the cases with the current level of IOP > 30 mm Hg, accounting for the nonlinear change in scleral shell strain with IOP level increased within the physiologically normal range [30]. The new examination technique will enable sensitive, accurate, reliable and safe determination of the diastolic OPP in the metarterioles of the the microvascular network of the ciliary body. We find it reasonable to name it impedance oculopneumoplethysmography since it combines the two examination techniques, ocular pneumoplethysmography (OPPG) and impedance plethysmography. The diagnosis process can be easily automatized based on digital signal processing of applied vacuum pressure data and eye rheogram data. Discussion A customary computational method for determination of the OPP based on the formula originally described by Lobstein, but not our method for determination of the diastolic OPP in the metarterioles of the microcirculatory bed of the ciliary body, requires preliminary measurements of IOP, and systolic and diastolic brachial artery blood pressure. The latter approach is advantageous for the early diagnosis of ocular vascular microcirculation disorders, since the perfusion pressure is measured at the output of the resistance vessels that substantially influence the perfusion pressure in the capillaries, whereas with the former approach, the perfusion pressure is determined at the level of the ophthalmic artery or central retinal artery. In addition, the method proposed to determine the diastolic OPP in the ciliary body metarterioles has an advantage over contact vasotonometry in the ACA, since it facilitates examination of the intraocular microcirculation, and it could be more sensitive and accurate due to integration of pulsation volume oscillations in a group of adjacent metarterioles located under two rheography electrodes. Moreover, the method proposed to determine the diastolic OPP in the ciliary body metarterioles has an advantage over ultrasound and laser Doppler methods for measurements of blood flow velocity in small arteries, since a high blood flow velocity determined by the latter methods is not always an evidence of a good blood supply to tissues, but may result from vasospasm or vessel stenosis with increased resistance to blood flow and worsened tissue blood supply. Conclusion First, the perfusion pressure in the capillaries characterizes the rate of metabolic exchange between blood and tissues. When decreased, it is followed by the development of microcirculatory (or miscovascular) tissue ischemia, with the subsequent development of tissue degeneration and dysfunction. As the perfusion pressure in the capillaries depends largely on the decrease in blood pressure in the resistance vessels, arterioles, determination of perfusion pressure at the level of large vessels provides little valuable clinical information. Therefore, a search for new methods for determining OPP at the level of the microvascular bed is deemed to be important. Second, the potential for diagnosing miscovascular ischemia in the tissue based on the findings of decreased (< 35 mm Hg) diastolic perfusion pressure in the metarterioles was demonstrated. Third, a new method for estimating the state of intraocular circulation with the help of impedance OPPG was proposed. It was demonstrated that the use of a ringshaped suction cup of original design with rheography electrodes (Pat. UA 112192) allows for estimating the OPP only in the intraocular vessels, with no influence of the superficial subconjunctival vessels of the anterior eye on the results of the study. Fourth, it was found, based on the modeling of the distribution of high frequency probing current in ocular tissues during ocular rheography, that the influence of a pulsatile component of the total ciliary body impedance on the amplitude of pulsations of the total impedance across rheography electrodes is two orders of magnitude greater than that produced by pulsations of the uveal impedance. An association of an initial decrease in magnitude of eye rheogram pulsation after an increase in IOP with pulse changes in blood volume in the metarterioles of the ciliary body was substantiated based on the Starling resistor model. Fifth, based on the mathematical analysis of IOP increase in local vacuum compression of the globe, it was found that, the increase in IOP is proportional to the squared area of the site of local vacuum compression and the level of applied vacuum, and inversely proportional to eye diameter raised to the power 4, provided that (1) the volume of fluid displaced under the site is within the range of 10-100 mm3, and (2) an increase in the IOP does not result in change in either the shape of the eye outside the site, or the volume of intraocular fluid. In addition, it was demonstrated that maintenance of the volume of the intraocular fluid is ensured by a decrease in aqueous production and aqueous outflow which matches and is simultaneous with the local vacuum compression and this effect is shown to be caused by the design features of the ring-shaped suction cup. Sixth, as per the calculations, for a 24-mm eye, the height of scleral deflection (averaged over the entire area of the site) required for a 35 mm Hg increase in IOP is substantially less than both the spacing between the ringshaped suction cup and perilimbal scleral surface, and the half of the distance between the internal and external margins of the ring. This makes a technical background for performing vacuum-induced compression with the achievement of the maximum possible diastolic OPP of 35 mm Hg (this pressure level is characteristic for physiologically normal conditions). Seventh, we theoretically substantiated the potential for diagnosing microvascular ciliary body ischemia by identifying low diastolic OPP in the metarterioles of the ciliary body microvascular system, based on the “local short-term vacuum compression” induced IOP rise at which a decrease in the pulsatile blood volume amplitude is registered by ocular rheography. Using a mathematical model, a formula was derived for estimating the increase in IOP based on the vacuum pressure applied, VAC, and globe diameter, D, with the factor K depending on the dimensions of the specific ring-shaped suction cup. Neither the initial IOP level, nor the Young's modulus of the sclera or scleral thickness affects the accuracy of the estimating the diastolic OPP by impedance oculopneumoplethysmography based on the formula derived. Finally, the examination technique proposed may be useful for early diagnosis of impaired vascular microcirculation in eyes with glaucoma (including lowtension glaucoma), myopia, diabetic angiopathy, peripheral retinal degeneration, age-related macular degeneration, or uveitis, and may enable estimating the efficiency of treatment for these disorders after conservative therapy or surgical procedures. References 1. Alm A. Ocular circulation. In: Hart HM, ed. Adler’s physiology of the eye, 9th ed. St Louis: Mosby-Year Book, 1992:198–227. 2. Alexandrov AnA, Tchukaeva II. [Microcirculatory ischemia and statins: Lessons of intervention cardiology]. Rational Pharmacotherapy in Cardiology. 2007;3(1):48–54. Russian 3. Vit VV. [The structure of the human visual system]. Odessa: Astroprint; 2003. Russian 4. Dorner GT, Polska E, Garhofer G, Zawinka C, Frank B, Schmetterer L. Calculation of the diameter of the central retinal artery from noninvasive measurements. Curr Eye Res. 2002 Dec;25(6):341–5. 5. Michelson G, Schuierer G. Absolute blood flow in the ophthalmic artery. Fortschr Ophthalmol. 1991; 88: 687–9. 6. Bunin AIa. [Ocular hemodynamics and methods for its study]. Moscow: Meditsina, 1971. Russian 7. Cioffi G, Granstam E, Alm A. Ocular circulation. In: Kaufman P, Alm A, eds. Adler’s Physiology of the Eye. 2003; 10th ed. St. Louis, London: Mosby: 747–84. 8. Large Medical Encyclopedia. Vol. 12. Moscow: Soviet Encyclopedia; 1980. p. 387. Russian 9. Lobstein A, Herr FJ. L'ophtalmodynamométrie dans le glaucome. Ann Ocul (Paris). 1966 Jan;199(1):38–69. French 10. Information Bulletin No. 14 issued 20.05.2001, based on Pat. 216690 of the Russian Federation. A61B5/02, A61B5/021. [Method for determining the ocular perfusion pressure]. Authors: Egorov VV, Sorokin EL, Smolyakova GP. Applicant and Patent Holder: SI IRTC “Eye Microsurgery”. Russian 11. Information Bulletin No. 7 issued 10.03.2008, based on Pat. 2318431 of the Russian Federation. А61В 5/02. [Method for examining the circulation in ocular vessels in glaucoma suspects]. Authors: Udovichenko OB, Kolesnikova MA. Applicant and Patent Holder: SEI of HPE Acad. Pavlov Ryazan State Medical University. Russian 12. Machekhin VA. [Relationship between tolerant intraocular pressure and brachial diastolic pressure]. Vestnik OGU. 2014;173(12):212–7. Russian 13. Information Bulletin No. 5 issued 20.02.2007, based on Pat. 2293509 of the Russian Federation. А61В 3/16 3/117. [Method for determining the perfusion pressure in the anterior eye]. Authors: Balalin SV, Bogdanov VN, Boriskina LN. Applicant and Patent Holder: SI S. Fyodorov IRTC “Eye Microsurgery”. Russian 14. Information Bulletin No. 22 issued 10.08.2011, based on Pat. 2425622 of the Russian Federation. А61В 3/16. [Vasotonometer]. Authors: Fokin VP, Balalin SV, Bogdanov VN. Applicant and Patent Holder: SI S. Fyodorov IRTC “Eye Microsurgery”. Russian 15. Information Bulletin No. 4 issued 10.02.2009, based on Pat. 2345700 of the Russian Federation. [Automatic computer vasotonometer for measurement of blood pressure in anterior ciliary vessels of the eye]. Authors: Gndoian IA, Shinkarenko TN, Ovchinnikov LG, Nikitin AV. Applicant and Patent Holder: SEI of HPE Volgograd State Medical University. Russian 16. Ulrich WD, Ulrich C. Oculo-oscillo-dynamography: a diagnostic procedure for recording ocular pulses and measuring retinal and ciliary arterial blood pressures. Ophthalm Res. 1985;17(5):308–17 17. Gee W, Oller DW, Wylie EJ. Noninvasive diagnosis of carotid occlusion by ocular pneumoplethysmography. Stroke. 1976 Jan-Feb;7(1):18-21 18. Strik F. OODG-Ulrich and OPG-Gee: a comparative study. Doc Ophthalmol. 1988; 69: 51–71 19. Ernest JT, Archer D, Krill AE. Ocular hypertension induced by scleral suction cup. Invest Ophthalmol. 1972 Jan;11(1):29-34. 20. Information Bulletin No. 23 issued 12.12.2016, based on Pat. of Ukraine №112,192 issued 16.05.2016. [Instrument for non-invasive measuring of the perfusion pressure in the the microvascular network of the ciliary body]. Author: Kovalchuk OG. Patent Holder: State Institution Filatov Institute of Eye Diseases and Tissue Therapy, NAMS of Ukraine. Ukrainian 21. Tielsch JM, Katz J, Sommer A, et al. Hypertension, perfusion pressure, and primary open-angle glaucoma. A population-based assessment. Arch Ophthalmol. 1995 Feb;113(2):216-21 22. Bonomi L, Marchini G, Marraffa M, et al.Vascular risk factors for primary open- angle glaucoma: the Egna-Neumarkt Study. Ophthalmology. 2000 Jul;107(7):1287-93 23. Quigley HA, West SK, Rodriguez J, et al. The prevalence of glaucoma in a population based study of Hispanic subjects: Proyecto VER. Arch Ophthalmol. 2001;119:1819–26 24. Memarzadeh F, Ying-Lai M, Chung J, Azen SP, Varma R; Los Angeles Latino Eye Study Group. Blood pressure, perfusion pressure, and open-angle glaucoma: the Los Angeles Latino Eye Study. Invest Ophthalmol Vis Sci. 2010 Jun;51(6):2872-7 25. Leske MC, Wu SY, Nemesure B, Hennis A. Incident open-angle glaucoma and blood pressure. Arch Ophthalmol. 2002 Jul;120(7):954-9 26. Leske MC, Wu SY, Hennis A, Honkanen R, Nemesure B; BESs Study Group. Risk factors for incident open-angle glaucoma. The Barbados Eye Studies. Ophthalmology. 2008;115(1):85–93 27. Cherecheanu AP, Garhofer G, Schmidl D, et al. Ocular perfusion pressure and ocular blood flow in glaucoma. Curr Opin Pharmacol. 2013;13(1):36-42. 28. Gabriel C. Compilation of the Dielectric Properties of Body Tissues at RF and Microwave Frequencies. Environ Heal. 1996;Report No.(June):21 29. Katznelson. [Ocular rheograohy]. Moscow: Meditsina, 1977. Russian. 30. Downs JC, Roberts MD, Burgoyne CF. Mechanical environment of the optic nerve head in glaucoma. Optom Vis Sci. 2008; 85:425–35 31. Chen C, Reed JF 3rd, Rice DC, et al. Biomechanics of Ocular Pneumoplethysmography. J Biomech Eng. 1993 Aug;115(3):231-8 32. Lyubimov GA. [On the role of rigidity in the development of intraocular pressure]. Glaucoma. 2006; 2:64–7. Russian
|