J.ophthalmol.(Ukraine).2018;2:17-22.
|
https://doi.org/10.31288/oftalmolzh/2018/2/1721 Mathematical substantiation of the method for assessing the risk of progression of diabetic retinopathy with serum leptin determination in patients with metabolic syndrome and diabetes mellitus V. N. Serdiuk,1,3 Dr Sc (Med), M. L. Kyryliuk,2 Dr Sc (Med), Prof., V. A. Ishchenko,3 Post-grad Student, Ophthalmologist 1 Dnipropetrovsk Medical Academy, Health Ministry of Ukraine; Dnipro (Ukraine) 2 Ukrainian Research Center for Endocrine Surgery, Transplantation of Endocrine Organs and Tissues, Health Ministry of Ukraine; Kyiv (Ukraine) 3 Dnipropetrovsk Regional Clinical Eye Hospital; Dnipro (Ukraine) E-mail: kmlazar@ukr.net TO CITE THIS ARTICLE: Serdiuk VN, Kyryliuk ML, Ishchenko VA. Mathematical substantiation of the method for assessing the risk of progression of diabetic retinopathy with serum leptin determination in patients with metabolic syndrome and diabetes mellitus. J.ophthalmol.(Ukraine).2018;2:17-21. https://doi.org/10.31288/oftalmolzh/2018/2/1721
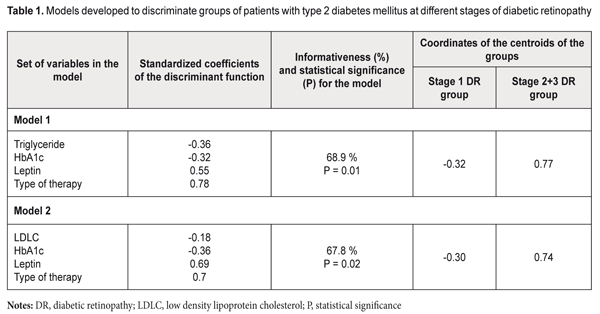
Background: Issues of not only the development of methods for treatment of diabetic retinopathy (DR), but also search for criteria reflecting the development and risk for progression of the disease in type 2 diabetes mellitus (T2DM), particularly in the presence of metabolic syndrome (MS)) have been actively addressed in the literature. Purpose: To improve the approach to diagnosis of DR in the presence of MS through the development of a mathematical algorithm for determining the nature of the development and the risk for progression of DR taking into account serum leptin levels. Materials and Methods: One hundred and three patients (187 eyes) with MS, T2DM and DR (men and women; mean age, 59.49±0.92 years; mean diabetes duration, 10.12±0.86 years; mean HbA1C, 9.10±0.19 %; mean body mass index (BMI), 33.00±0.64 kg/m2), were involved in the study. The diagnostic accuracy and predictive value of serum leptin determination were assessed by discriminant analysis. Models with linear combinations of the serum leptin, low density lipoprotein cholesterol (LDLC), triglyceride (TG), HbA1C, type of anti-hyperglycemic therapy (oral anti-hyperglycemic medication or insulin therapy) were developed, and, subsequently, formulas for classification-relevant discriminant functions were derived. Results: The formulas for classification-relevant discriminant functions were derived based on the results of physical examination, imaging and laboratory tests, and subsequent assessment of clinical signs of T2DM (HbA1C), MS (LDLC, TG and leptin) and DR stage, and taking into account the type of anti-hyperglycemic therapy. Using the formulas, one can determine the probability of progression or stabilization of DR. The use of the algorithm assessing the prediction of the development of DR made it possible to predict stabilization of the course of DR in the majority (57.7%) of cases. Of these, 38.25%, 38.25%, and 23.5% were at stage 1 DR, stage 2 DR and stage 3 DR, respectively (р=0.02 or р=0.01, depending on the type of mathematical model). Conclusion: We described a new technique for assessing the risk for progression of DR in patients with both T2DM and MS, taking into account serum leptin levels, with the informativeness of 67.8% or 68.9%. Keywords: diabetic retinopathy, metabolic syndrome, leptin Introduction In view of high and increasing prevalence of diabetes mellitus (DM), the latter is a major cause for concern in the field of public health, particularly given high rates of vascular and neurological sequelae (like diabetic retinopathy (DR)), diabetic renal disease, diabetic polyneuropathy, and diabetic foot syndrome) of the disease [1]. The International Diabetic Federation predicts that the number of people with diabetes in the world will rise to more than 500 million in 2025, [2] and 90% of them will be patients with type 2 DM (T2DM). It is DM that is a major cause of blindness, accounting for 12% of blind working-age patients [2]. Adipose tissue-[3] and adipocytokine-induced insulin resistance plays a major role in the development of hormonal and metabolic disturbances in T2DM [4]. Compensatory hyperinsulinemia arising in this setting leads to increased insulin-like growth factor-1 (IGF-I) production which can contribute to the development of proliferative DR [5]. Issues of the epidemiology of and development of methods of treatment for diabetic retinopathy (DR) [2], and search for criteria reflecting the development and risk for progression of the disease in T2DM (particularly in the presence of metabolic syndrome (MS)) have been actively addressed in the literature. The techniques for differential diagnosis of the early DR stages accompanied by metabolic disturbances [6], diagnosis of the early DR stages based on verification of markers of retinal damage (determination of the expression of antibodies to retinal S-antigen in the aqueous humor of diabetic patients), and total tear production [7], and prediction for progression of DR and diabetic macular edema (DME) have been reported [8]. The latter technique involves the OCT-based estimation of the volume of macular edema, fundus microperimetry-based assessment of changes in macular sensitivity threshold, measurement of plasma hemoglobin A1C levels, and enzyme immunoassay (EIA)-mediated detection of vascular endothelial growth factor (VEGF) levels in the aqueous humor. In addition, the integral predictor for the risk of progression of DR and DME is calculated based on correlations between morphological and biochemical indices. Ukrainian researchers [9] have investigated blood levels of different cytokines in patients with pre- and proliferative stages of DR prior to and at different time points after pan-retinal laser photocoagulation (PRLP) and demonstrated that, in DR patients with high baseline blood cytokine levels, PRLP failed to stop the progression of the disease. Those authors believe that the findings of their study can be used for predicting the outcome of PRLP in patients with DR. In our point of view, the drawback of the above techniques with regard to assessment of the risk for progression of disease in patients with both T2DM and MS is that they do not use the data on blood leptin levels, the major adipokine indicator of adipose tissue function. Previously, we have investigated blood leptin levels in patients with T2DM and manifestations of MS, and found that (1) DR arouse in the presence of hyperleptinemia (with the 95% confidence interval of 14.65 to 22.25 ng/mL at stage 1 compared to the norm of 2.05 to 11.09 ng/mL) and (2) there was a statistically significant increase in leptin resistance with progression of diabetic retinopathy from stage 1 to stage 2 (i.e., from non-proliferative stage to pre-proliferative stage, respectively, with blood leptin levels increased from 18.45±2.69 ng/mL to 32.37±5.82 ng/mL, respectively, P = 0.005). In addition, development of proliferative DR was associated with a statistically significant increase in leptin resistance as patients were re-assigned to a group for older patients and/or for those with longer duration of T2DM [10]. The study purpose was to develop a model (an algorithm) for assessing the prognostic value of serum leptin in order to assess the probability of progression of DR in patients with both T2DM and MS. Materials and Methods One hundred and three patients (187 eyes) with MS, T2DM and DR (men and women; mean age, 59.49±0.92 years; mean diabetes duration, 10.12±0.86 years; mean HbA1C, 9.10±0.19 %; mean body mass index (BMI), 33.00±0.64 kg/m2), were assigned to the main group and underwent the study. They were divided into three DR groups based on the stage of DR. The control group included patients with MS and without T2DM (23 individuals of both sexes; mean age, 49.26±2.14 years). When performing the ranking of patients for discriminant analysis, the stage 2 DR group was aggregated with the stage 3 DR group for convenience to form the stage 2+3 DR group based on the pathognomonic sign (portents of proliferation or actual proliferation) [10]. Inclusion criteria were informed consent, age above 18 years, BMI > 24.99 kg/m2. Additional inclusion criteria for the main group were presence of T2DM and DR. Exclusion criteria were endocrine or body system disorders leading to obesity (Cushing's syndrome, hypothyroidism, hypogonadism, polycystic ovarian syndrome, or other endocrine disorders, including hereditary disorders, and hypothalamic obesity), type 1 diabetes mellitus, acute infectious disorders, history of or current cancer, decompensation of comorbidities, mental disorders, treatment with neuroleptics or antidepressants, proteinuria, clinically significant maculopathy, glaucoma or cataract [11]. The study followed the ethical standards stated in the Declaration of Helsinki and was approved by the Local Ethics Committee. The presence of metabolic syndrome was identified according to American Heart Association National Cholesterol Education Programme Adult Treatment Panel III criteria and International Diabetes Federation (IDF) consensus criteria. According to the IDF definition, for a person to be defined as having the metabolic syndrome, central obesity is an essential requirement, while insulin resistance is not [12]. Patients’ blood samples were investigated for total cholesterol (TC), high density lipoprotein cholesterol (HDLC), low density lipoprotein cholesterol (LDLC), triglyceride (TG), fasting and postprandial glucose, and HbA1C. Plasma glucose levels were measured by glucose-oxidase test. TС, HDLC, LDLC and TG levels were measured by spectrophotometry. HbA1c levels were measured using high pressure liquid chromatography (HPLC). Serum leptin levels were measured by EIA and were considered normal if they ranged from 2.05 to 11.09 ng/ml. All patients underwent comprehensive eye examination including visual acuity assessment, autorefractometry, ocular tonometry, perimetry, biomicroscopy, and fundus photography and fluorescence angiography. DR was diagnosed according to the classification specified in The Medical Care Protocol for Patients with Diabetic Retinopathy (Decree of the Ministry of Public Health of Ukraine No. 356 dated 22 May 2009 As Amended by Decree of the Ministry of Public Health of Ukraine No. 574 dated 5 August 2009). Patients with T2DM underwent examination and treatment as per the Decree of the Ministry of Public Health of Ukraine No. 1118 On Approval and Implementation of Medical and Technological Documents on Standartization of Medical Care in Type 2 Diabetes Mellitus dated 21 December 2012. Anti-diabetic therapy (ADT) included metformin, either alone (type 1 ADT), or in combination with oral anti-hyperglycemic medication (metformin + OAHGM, type 2 ADT) or insulin therapy (metformin + IT, type 3 ADT). The diagnostic and predictive values of serum leptin determination were assessed by discriminant analysis. Models with linear combinations of the leptin variable and biochemical characteristics of carbohydrate and adipose metabolism were developed to derive the linear combination that discriminates best between studied patient groups (i.e., with the best statistical significance, P < 0.05). Statistical analyses were conducted using Statistica 9.0 (StatSoft, Tulsa, OK, USA) software. Results Table 1 compares the parameters of the developed models. Along with the leptin variable, each model involved characteristics of lipid carbohydrate metabolism (TG or LDLC; HbA1С) and type of therapy for T2DM.
Informativeness and statistical significance of Model 1 were 68.9% and P = 0.01, respectively. The centroids of stage 1 DR and Stage 2+3 DR were positioned in the negative-value region (-0.32) and positive-value region (0.77), respectively, of the DR severity axis. Based on the positions of the group centroids on the DR severity axis and on the positive values of standardized coefficients of the discriminant function, it was concluded that the DR severity is positively associated with the leptin level (Model 1 and Model 2). Given the values of the standardized coefficients, TG and HbA1С contribute to the position of the centroid of the stage 1 DR group, whereas leptin and type of therapy for T2DM contribute to the position of the centroid of the stage 2+3 DR group. Model 2 involves the LDLC but not the LG, and its informativeness and statistical significance were 67.8% and P = 0.02, respectively. The centroids of the stage 1 DR group and the stage 2+3 DR group were positioned in the negative-value region (-0.30) and positive-value region (0.74), respectively, of the DR severity axis. Given the values of the standardized coefficients, LDLC and HbA1С contribute to the position of the centroid of the stage 1 DR group, whereas leptin and type of therapy for T2DM contribute to the position of the centroid of the stage 2+3 DR group. The conducted analysis allowed us to develop an algorithm for assessing the prediction for the development of DR in patients with MS and T2DM. The classification functions (CF) computed based on the variables found from the above developed models provided the basis for predicting the development of DR. The formulas for CF from Model 1 are as follows: CF1= 0.36 * TG + 1.59 * HbA1С + 2.25 * ADT_Type + 0.06 * Leptin – 11.48 CF2= 0.12*TG + 1.43 * HbA1С + 3.37 * ADT_Type + 0.09 * Leptin – 13.05 The formulas for CF from Model 2 are as follows: CF1 = 3.32 * LDLC + 1.40 * HbA1С + 2.75 * ADT_Type + 0.015 * Leptin – 15.69 CF2 = 3.13 * LDLC + 1.23 * HbA1С + 3.38 * ADT_Type + 0.059 * Leptin – 17.1 A step-by-step approach to diagnostic decision making should be used. First, blood samples are tested for TG (or LDLC), HbA1С and leptin levels, and the patient is assigned a code for ADT_Type (metformin-only, 1; metformin + OAHGM, 2; or metformin + IT, 3). Second, CF1 and CF2 values are calculated based on clinical and laboratory data. Finally, the two values are compared to determine which is greater. The predictive decision is made by selecting the classification function with the greater value. Thus, if CF1 > CF2, the process can be stabilized at this stage given an adequate glycemic control (through compensation of carbohydrate metabolism) and body-mass control as well as patient compliance. If CF1 < CF2, the pathological process may progress to the next stage or even within stage 3, and there is an urgent need to reduce BMI, and to correct the ADT and the blood lipid profile. Discussion Model parameters (like coefficients of the discriminant function and centroids) were not the subject for discussion in the literature with respect to mechanisms of progression of different pathological processes [13] (the onset and development of DR, in particular) [6] yet. In practice, however, we may use such parameters in order to assess diagnostic and predictive value of determination of biologically active substances when (1) assessing the risk of DR progression and (2) checking whether or not a mathematical procedure for building a model for any typical pathological process (inflammation, proliferation, tumor growth, or, in our case, microvascular sequelae of T2DM) will lead to a misunderstanding or even nonsence with regard to the course or outcome of the disease. In our case, the very algorithm for calculating CF is the main finding of the mathematical analysis. We would like to note the following regarding the issue under discussion. When using the algorithm above in order to assess the state of patients with T2DM and DR, we predict not alternative states or variations of the sign (like health/disease, norm/pathology, or disease/full recovery), but sequential stages of the process of the onset and development of pathological fundus changes, that are, unfortunately, irreversible. Therefore, the sense of the CF components should be understood as follows. Diabetes control parameters (amount of glycosylated hemoglobin, HbA1С, and metabolic factors like, in our case, TG and LDLC) play a major role in non-proliferative DR. In pre-proliferative and proliferative DR, the importance of metabolic factors gradually decreases in favor of quality of ADT and diabetic complications, as irreversible retinal tissue changes have already occurred. Even if these parameters are controlled properly in these DR stages, the process will not become reversible, although stabilization of the pathological process will be possible. In addition, in stages 2+3 of DR, the pathogenic obesity-related role of leptin becomes more important, along with the role of ADT type. The technical result of our study is an improvement in the accuracy of predicting the course of DR for patients with DR in MS which was achieved by using a mathematical algorithm to determine the nature of the development and the risk of progression of DR. The prognostic model is to assist practitioners in the management (i.e., decision-making related to the approaches aimed at either stabilization or slowing the process of damage to the uvea) of patients with both T2DM and MS. The use of the algorithm assessing the prediction of the development of DR made it possible to predict stabilization of the course of DR in the majority (57.7%) of cases. Of these, 38.25%, 38.25%, and 23.5% were at stage 1 DR, stage 2 DR and stage 3 DR, respectively (р=0.02 or р=0.01, depending on the type of mathematical model). Conclusion Depending on the model version, the informativeness of the model developed for assessing the diagnostic and prognostic significance of serum leptin in the progression of DR in patients with T2DM was 67.8% or 68.9%. References
|