J.ophthalmol.(Ukraine).2016;3:49-53.
|
https://doi.org/10.31288/oftalmolzh201814953 Relationship between diabetic retinopathy and cerebral perfusion in type 2 diabetes mellitus Zherdiova N.M., Cand Sc (Med), Medvedovska N.V., Dr Sc (Med), Makeev S.K., Dr Sc (Med), Mankovsky BN, NAMS Corr Member, Prof, Dr Sc (Med) Shupyk National Medical Academy of Postgraduate Education; Kyiv (Ukraine) E-mail: nadejda05.1977@gmail.com TO CITE THIS ARTICLE: Zherdiova NM, Medvedovska NV, Makeev SK, Mankovsky BN. Relationship between diabetic retinopathy and cerebral perfusion in type 2 diabetes mellitus. J.ophthalmol.(Ukraine).2016;3:49-53. https://doi.org/10.31288/oftalmolzh201814953
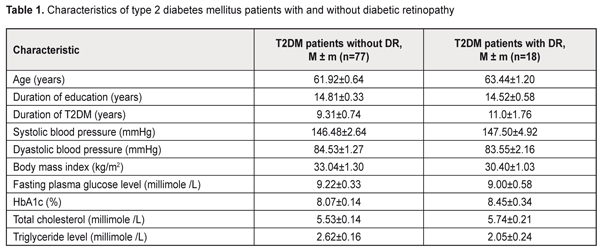
Background: Compared to patients without diabetic retinopathy (DR), those with DR demonstrate better cognitive performance. It is therefore reasonable to hypothesize that retinal microcirculatory changes might be a marker of impaired cerebral microcirculation. Purpose: To examine the association between the presence of diabetic retinopathy and cerebral perfusion in patients with type 2 diabetes mellitus (T2DM). Materials and Methods: Ninety-five T2DM patients aged 50-70 years were enrolled. They were divided into two groups, those with DR (DR group) and without DR (non-DR group). Regional cerebral blood flows (rCBF) were measured with 99mTc-HMPAO single-photon emission computed tomography (SPECT). Results: Linear regression analysis revealed negative relationships between DR and cerebral perfusion impairments in right frontal lobe (B (95% CI) = 0.58 (-0.98/-0.18); P = 0.01), left frontal (B (95% CI) = -0.55 (-0.99/-0.12); P = 0.02) lobe, right parietal lobe (B (95% CI) = -0.68 (-1.19/-0.16); P = 0.01), left parietal lobe (B (95% CI) = -0.79 (-1.31/-0.27); P = 0.00); right occipital lobe (B (95% CI) = -0.61(-1.17/-0.06); P = 0.03), left occipital lobe (B (95% CI) = -0.81 (-1.35/-0.26); P = 0.00); right cerebral cortex (B (95% CI) = -0,58 (-0.98/-0.18); P = 0.01) and left cerebral cortex (B (95% CI) = -0.54 (-91/-0.17); P = 0.01). Conclusions: The findings might indicate that, in diabetic patients, damage to retinal microvessels develops somewhat in parallel with that to the brain. Keywords: diabetic retinopathy, type 2 diabetes mellitus, cerebral blood flow Introduction The observations of the United Kingdom Prospective Diabetes Study (UKPDS) indicate that intensive glucose control starting at the time of diagnosis is associated with a reduction in the risk of microvascular disease [1]. Unfortunately, in real clinical practice, due to late diagnosis of diabetes mellitus (DM), the person visits the doctor when complications are already present. Although some diabetic microvascular complications (like diabetic retinopathy (DR) and nephropathy) can be early detected through standard well-established diagnostic methods, detecting cerebral microvascular complications and establishing the cognitive status require more sophisticated instrumental methods. In routine clinical practice, usually transcranial Doppler is performed; however, it helps diagnose abnormalities of the middle cerebral artery, but not those of the cerebral microvessels. DM has been clearly associated with increased risk of cognitive decrements [2]. According to a meta-analysis of DM, patients with this disease, when compared to non-diabetic patients, performed poorer on memory, information processing speed and executive functions [2, 3]. The Rotterdam Study has found that DM almost doubled the risk of dementia (relative risk [RR] 1.9 [1.3 to 2.8]) [4], which agrees with the findings of the Hisayama study [5]. The pathogenesis of this association is related mostly to hyperglycemia and impaired brain insulin signaling [6]. DM patients also demonstrated changes in MRI-based brain structures compared to controls. In addition, relationships have been found between DM and decreases in brain volume and loss with time [7-10]. Furthermore, structural brain changes in diabetics have been revealed even in the absence of cognitive impairment [11, 12]. Early detection of cerebral microvessel changes in diabetics is therefore of primary importance. Previously, we have found a relationship between retinopathy and cognitive impairment in patients with type 2 diabetes mellitus (T2DM). Patients diagnosed with T2DM without clinical signs of diabetic retinopathy (DR) demonstrated better working memory, memory flexibility and executive functions [13] than T2DM patients with DR. It is therefore reasonable to hypothesize that retinal microcirculatory changes might be a marker of impaired cerebral microcirculation The purpose of the study was to examine the association between the presence of diabetic retinopathy and cerebral perfusion in patients with T2DM. Materials and Methods Ninety-five type 2 diabetes mellitus patients aged 50-70 years were enrolled. They were divided into two groups, those with DR (DR group, 18 patients) and without DR (non-DR group). Inclusion criteria were age (50 to 70 years), T2DM, ability to communicate and understand tasks, ability to read and write in Ukrainian or Russian, and signed informed consent. Exclusion criteria were type 1 DM, depression, history of stroke or craniocerebral injury, alcohol addiction, or occupational diseases that may influence study results. Two questionnaires were used to assess depression, the Centre for Epidemiologic Studies Depression (CES-D) and Hospital Anxiety and Depression (HAD) scales. Patients with CES-D scores of 19 or more and HAD scores of 11 or more at baseline were considered to have depression symptoms and were excluded from the study. Ocular examination included examination of eyelids, lacrimal apparatus and conjunctiva by oblique illumination; visual acuity; transpalpebral IOP measurements with the portable contactless tonometer, biomicroscopy of the anterior eye; and fundus examination with direct and indirect ophthalmoscopy following pupil dilation with irifrin. The level of DR was graded as no DR (grade 1); mild non-proliferative DR (NPDR) (grade II); moderate NPDR (grade III); severe NPDR (grade IV); or proliferative DR (grade 5), based on the International Classification of DR (ICDR) Disease Severity Scale [14]. Patients with grades 3 to 5 DR were included in the DR group. At baseline, glycemic levels were measured to exclude the influence of hypoglycemia (below 3.9 mmole/L) or hyperglycemia (above 3.9 mmole/L) on study results. Regional cerebral blood flows (rCBF) were measured with single-photon emission computed tomography (SPECT), a non-invasive CT technique for diagnosing cerebral hemodynamic impairments with the use of perfusion radiopharmaceuticals. Regional perfusion directly corresponds to regional cerebral blood flow and is coupled to metabolism. All subjects had 740 to 1100 MBq of technetium-99m hexamethyl propyleneamine oxime (Tc-99m HMPAO) injected intravenously into an ante-cubital vein and were scanned within 20 minutes of injection with a dual-head gamma camera (Siemens E.CAM 180) with a low energy high resolution collimator (matrix, 128 x 128). SPECT scans were preprocessed and reconstructed using Symbia.net (Siemens). Manual correction for motion artifacts was performed. Images were iteratively reconstructed with OSEM2D (4 iterations, 12 subsets), and smoothed with a 10-mm Gaussian filter. The automated version of Chang attenuation correction was applied. The resulting scans were quantified using Neurogam quantification software from Siemens, version 5.3, to obtain the region wise quantification and comparative analysis in respect of the database of 24 healthy elderly individuals. Differences in perfusion were reported in the standard deviation from normal. Quantitative perfusion measurements for the whole brain and hemispheres (frontal, occipital, parietal and temporal lobes, cerebellum, caudate nucleus, putamen and thalamus) were performed. Statistical analysis was performed using SPSS 23 (SPSS Inc., Chicago, IL, USA). A General Linear Model Univariate Analysis of Variance (UNIANOVA) was used to compare the DR and non-DR groups, with adjustments made for age, education level and sex. The Student t test was applied to compare the mean values of the patient groups. Linear regression was used to establish the relationship between retinopathy and state of cerebral perfusion. Data were presented as unstandardized coefficients (B) with corresponding 95% CI, with adjustments made for age, education level and sex. Education level was calculated based on duration of education. Statistical significance was considered at p < 0.05. Results and Discussion There were no statistical differences between groups with respect to age, duration of education, duration of disease, glycemia level, HbA1c level, body mass index (BMI), total cholesterol, triglyceride levels, and blood pressure. Table 1 presents patient characteristics.
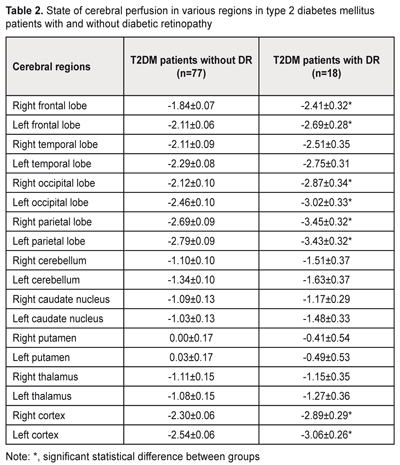
Statistical reductions in cerebral perfusion in frontal, occipital, and parietal lobes and cerebral cortex from both hemispheres were found in patients with DR as compared with those without DR (Table 2). No significant differences in cerebral blood flow between the DR and no-DR were found with regard to other cerebral sites.
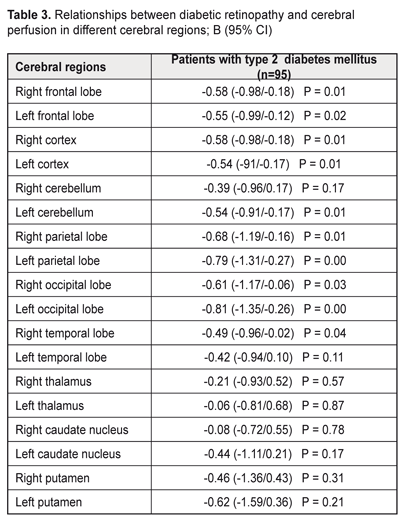
Linear regression revealed negative relationships between DR and cerebral perfusion impairments in frontal, occipital, and parietal lobes and cerebral cortex from both hemispheres (Table 3). In addition, relationships were found between DR and cerebral perfusion impairments in left temporal lobes and left cerebral cortex.
The frontal area includes primary motor and pre-motor cortices, secondary motor area, oculomotor cortices, and speech centre. Therefore, microcirculation impairments in this area result in impairments of behavioral response, emotional behavior, attention, deficiency, decision making. In addition, the affective-motivational pain component disappears despite the maintenance of pain sensitivity. The parietal area includes the somatosensory cortex and parietal association cortex that is involved in somatosensory information processing [15]. As the parietal area is linked with the frontal area, somatosensory information influences voluntary movement. Visual signals come from the occipital area to the parietal association cortex and frontal lobe to provide for the visual motor control. In addition, normally, somatosensory information is transferred to the sensory (Wernicke's) speech center on the dominant side, whereas the non-dominant side is involved in spatial analysis. The main function of the occipital area is processing of visual information and visual perceptions. The occipital oculomotor fields influence eye movement, miosis and accommodation. Therefore, diabetic retinopathy results in impairments of visual perception, visual processing, and transfer of the somatosensory information to the parietal and frontal areas with subsequent impairments of attention, behavioral response and executive functions. In some studies on cerebral perfusion in patients with type 1 diabetes mellitus, hypoperfusion was found in frontal, frontotemporal, temporal, parietal, occipital and cerebellar areas [16]. In a study on the effect of T2DM on global and regional cerebral perfusion [17], the cerebral circulation of patients with proliferative retinopathy was slightly lower than that of patients with nonproliferative retinopathy and without retinopathy. These differences, however, were not significant, likely due to the small sample size. In the present study, we investigated relationships between the presence of diabetic retinopathy and cerebral perfusion in frontal, occipital, and parietal lobes from both hemispheres in patients with T2DM. Our findings might indicate that damage to retinal microvessels develops in parallel with that to the brain. In addition, these findings (1) warrant comprehensive examination of cerebral blood flows in diabetic patients with DR, and (2) indicate that patients with signs of DR have an increased risk of cerebrovascular damage. Conclusions
First, relationships between the presence of diabetic retinopathy and cerebral perfusion impairments in patients with T2DM were found. Second, compared to patients without DR, those with DR have reduced cerebral perfusion in frontal, occipital, and parietal lobes. Finally, our findings might indicate that, in diabetic patients, damage to retinal microvessels develops somewhat in parallel with that to the brain.
References
|