J.ophthalmol.(Ukraine).2018;1:43-48.
|
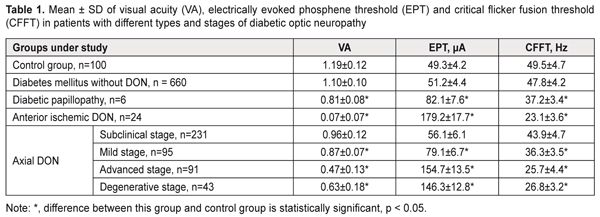
https://doi.org/10.31288/oftalmolzh201814348 Clinical and OCT features of different types and stages of diabetic optic neuropathy P.A. Bezditko 1, Dr Sc (Med), Prof.; M.A. Karliychuk 2, Cand Sc (Med) 1 Kharkiv National Medical University ; Kharkiv (Ukraine) 2 Higher State Educational Establishment of Ukraine «Bukovinian State Medical University»; Chernivtsi (Ukraine) E-mail: mari13karli@gmail.com TO CITE THIS ARTICLE: Bezditko PA, Karliychuk MA. Clinical and OCT features of different types and stages of diabetic optic neuropathy. J.ophthalmol.(Ukraine).2018;1:43-8. https://doi.org/10.31288/oftalmolzh201814348 Background: The advent of optical coherence tomography (OCT) has offered new opportunities for differential diagnosis of diabetic optic neuropathy (DON). Purpose: To identify clinical and OCT features of different types and stages of DON. Materials and Methods: A total of 575 patients (1150 eyes) with type 2 diabetes mellitus (T2DM) were included in the prospective analysis of the features of optic nerve damage. For comparison, we used data from a group of 50 age- and sex-matched healthy control patients. In addition to routine ocular examination, patients underwent ophthalmochromoscopy, OCT of the retina and optic nerve, and electrical physiological studies. Results: In diabetic papillopathy, anterior ischemic DON, and degenerative-, advanced-, mild-, and subclinical-stage axial DON groups, mean ganglion cell complex focal loss volume values were 21.7, 20.5, 17.3, 13.4, 10.3, and 7.5 times higher, respectively, than in controls. In diabetic papillopathy, anterior ischemic DON, and advanced-stage axial DON groups, mean peripapillary retinal thickness values were 92.2%, 84.7%, and 38.7% higher, respectively, than in controls, whereas in subclinical-, mild-, and degenerative-stage axial DON groups, the values were 8.0%, 13.8%, and 20.5% lower, respectively, than in controls. Conclusion: We have identified clinical and OCT features of different types and stages of DON in patients with T2DM. Keywords: diabetic optic neuropathy, clinical and OCT features, ganglion cell complex focal loss volume, peripapillary RNFL thickness Introduction Diabetic optic neuropathy (DON) is a manifestation of systemic diabetic polyneuropathy, in which damage to the optic nerves (CNII) is observed [1-7]. The disease is detected in 7-30.7% of patients with diabetes mellitus (DM) [1-6], and can cause visual disability, because in most patients it is diagnosed too late, at a stage when a large proportion of neurons is already irreversibly lost [5]. The advent of optical coherence tomography (OCT) offered new opportunities for early and advanced diagnosis of DON as it provides an approach for life-time investigation of retinal ganglion cells whose axons form the optic nerve [3, 8, 9]. Measurements of retinal ganglion layer thickness and retinal nerve fiber layer (RNFL) thickness have been increasingly used for diagnosing glaucomatous optic neuropathy [10-12]. The evaluation of retinal nerve fiber layer (RNFL) and retinal ganglion cell layer has been of vital importance for diagnosing glaucomatous optic neuropathy [10-12]. It is reasonable to consider the possibility of the OCT-based detection of and differential diagnosis for diabetic optic nerve damage. To the best of our knowledge, there have been no reports on this subject. The purpose of the study was to identify clinical and OCT features of different types and stages of diabetic optic neuropathy. Materials and Methods A total of 575 patients (1150 eyes) with type 2 diabetes mellitus (T2DM) were included in the prospective analysis of the features of optic nerve damage. For comparison, we used data from a group of 50 age- and sex-matched healthy control patients (50 eyes). Inclusion criteria were no history of glaucoma; Goldmann IOP of 21 mmHg or less; emmetropic, hypermetropic or low myopic eyes; no cataract or mild age-related cataract; and no history of surgery or laser. The patients’ age ranged from 44 to 69 years (mean ± SD, 55.9±7.8 years). Four hundred and thirteen (71.8%), 93 (16.2%) and 69 (12.0%) had duration of DM of <5, 5-10 and >10 years, respectively. Four hundred and fifty (78.3%), 76 (13.2%) and 49 (8.5%) had compensated DM (HbA1C ≤ 7%), subcompensated DM (7% ≥ HbA1C ≤ 9%), and decompensated DM (HbA1C ≥ 9%), respectively. Patients were divided into groups depending on the type and stage of DON. 1. Axial (or chronic) DON is a type of diabetic optic nerve injury in which pathologic changes were found throughout the whole course of the optic nerve. This type of DON was found in 460 eyes (40%) of patients, and its clinical course tended to proceed in a series of stages. The subclinical (or asymptomatic) stage was identified by OCT of the retina and optic nerve, with general or local thinning of the ganglion cell complex (GCC) and/or sectoral thinning of the peripapillary RNFL demonstrated by OCT. This stage was found in 231 eyes (20.1%) of total patients, and in 50.2% of eyes of those exhibiting axial DON. The mild stage was identified by redless light ophthalmochromoscopy (with darkened optic disc haze and mild blurring of disc margins at crossings by large vessels, and disc hyperemia on palpation of the globe), and electrically evoked phosphene test (with slightly increased electrically evoked phosphene threshold and decreased lability of the optic nerve). This stage was found in 95 eyes (8.3%) of total patients, and in 20.7% of eyes of those exhibiting axial DON. The advanced stage was identified by ophthalmoscopy (with optic disc hyperemia and mild general or local optic disc edema, < 1.0 mm), purple-light ophthalmochromoscopy (with blue edematous and red healthy tissue of the optic disc), and yellow-and green light ophthalmochromoscopy (with thickened retinal nerve fibers). In addition, electrically evoked phosphene test demonstrated moderately increased electrically evoked phosphene threshold and decreased lability of the optic nerve. This stage was found in 91 eyes (7.9%) of total patients, and in 19.8% of eyes of those exhibiting axial DON. The degenerative stage was identified by ophthalmoscopy (with different degrees of optic disc discoloration and sharp optic disc margins), purple-light ophthalmochromoscopy (with optic disc pallor), and yellow-and-green light ophthalmochromoscopy (with rupture and loss of peripapillary nerve fibers). In addition, electrically evoked phosphene test demonstrated various degrees of increase in electrically evoked phosphene threshold and decreased lability of the optic nerve. This stage was found in 43 eyes (3.7%) of total patients, and in 9.3% of eyes of those exhibiting axial DON. 2. Diabetic anterior ischemic optic neuropathy (or acute DON) is an impairment of circulation in the intraocular portion of the optic nerve, in which the loss of visual acuity depended on the loss of nerve filaments. This type of DON was found in 24 eyes (2.1%) of total patients. 3. Diabetic papillopathy had the following features: significant optic nerve edema and telangiectasia of epipapillar capillaries, with no or mild impairment of visual function and transient clinical symptoms. This type of DON was found in 6 eyes (0.05%) of total DM patients. All patients underwent a routine eye examination including best-corrected visual acuity (BCVA) and a dilated fundus examination. In addition, ophthalmochromoscopy (Vodovozov electric ophthalmoscope, OEV-2 model), retinal and optic nerve OCT (RTVue–100, Optovue, Fremont, CA), and electrical physiological studies were performed. Electrically evoked phosphene thresholds (EPT) were measured to evaluate retinal sensitivity, and critical flicker fusion thresholds (CFFT) were assessed using electric phosphene stimulation with a KNSO-2 apparatus (FOSFEN, Odesa, Ukraine). Results and Discussion In patients with DON, visual acuity and electrical physiological parameters of the retina and optic nerve demonstrated relationships with type and stage of the disease (Table 1).
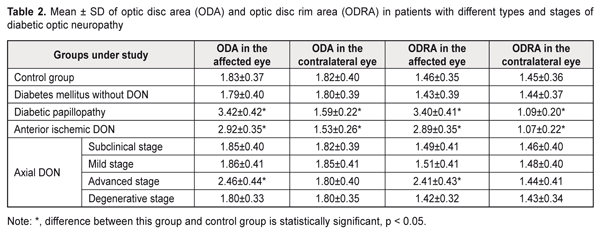
Thus, in mild-stage axial DON, diabetic papillopathy, degenerative-stage axial DON, advanced-stage axial DON and anterior ischemic DON groups, the mean visual acuity values were 26.9%, 31.9%, 47.1%, 60.5%, and 94.1% lower, respectively, than in controls (1.19 ± 0.12) (P < 0.001),and the mean EPT values were 1.6, 1.7, 3.0, 3.1, and 3.6 times higher, respectively, than in controls (49.3 ± 4.2 μA, P < 0.001). In addition, in diabetic papillopathy, mild-stage axial DON, degenerative-stage axial DON, advanced-stage axial DON and anterior ischemic DON groups, the mean CFFT values were 26.7%, 45.9%, 48.1%, and 53.3% lower, respectively, than in controls (49.5 ± 4.7 μA, P < 0.001). In DM patients without DON, and in those with subclinical-stage axial DON, visual acuity values and electrical physiological parameters of the retina and optic nerve were not significantly different from those in controls (P > 0.05). Based on the studies above, we found OCT features in different types and stages of diabetic optic neuropathy In diabetic papillopathy, anterior ischemic DON, and advanced-stage axial DON groups, the mean optic disc area was 86.9%, 59.6%, and 34.4% greater, respectively, than in controls (1.83 ± 0.37 mm², P ˂ 0.001, Table 2), and the mean optic disc rim area was 132.9%, 97.9%, and 65.1% greater, respectively, than in controls (1.46 ± 0.35 mm², P ˂ 0.001). In DM patients without DON, and in those with subclinical-stage, mild-stage and degenerative-stage axial DON, mean optic disc area and mean optic disc rim area were not significantly different from those in controls (P > 0.05). In anterior ischemic DON and diabetic papillopathy groups, the mean optic disc area in the contralateral eye was 15.9% and 12.6% lower, respectively, than in controls (1.82 ± 0.40 mm², P ˂ 0.001), and the mean optic disc rim area was 26.2% and 24.8% lower, respectively, than in controls (1.45 ± 0.36 mm², P ˂ 0.001). In DM patients without DON and in those with axial DON, mean optic disc area and mean optic disc rim area in the contralateral eye were not significantly different from those in controls (P > 0.05).
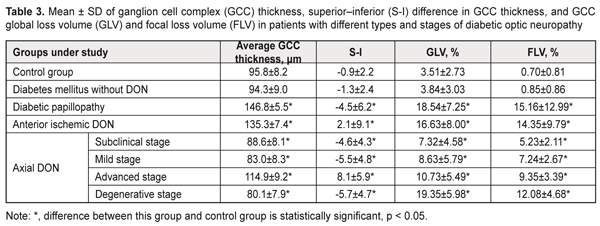
In diabetic papillopathy, anterior ischemic DON, and advanced-stage axial DON groups, mean GCC thickness values were 40.6%, 29.6%, and 19.9% higher, respectively, than in controls (95.8 ± 8.2 μm, P ˂ 0.001), whereas in subclinical-stage DON, mild-stage DON and degenerative stage DON, it was 7.5% (р < 0,05), 13.4% (р<0,001) and 16.4% (р<0,001) lower, respectively, than in controls (Table 3). In diabetic papillopathy, subclinical-stage DON, mild-stage axial DON, degenerative-stage axial DON, mean superior–inferior differences in GCC thickness were 4.0, 4.1, 5.1, and 5.3 times lower, respectively, than in controls (-0.9 ± 2.2, P < 0.001). In anterior ischemic DON and advanced-stage axial DON groups, mean superior–inferior differences in GCC thickness values were 3.3 and 9.0 times higher, respectively, than in controls (-0.9 ± 2.2, P < 0.001). In diabetic papillopathy, subclinical-stage DON, mild-stage axial DON, degenerative-stage axial DON, anterior ischemic DON, and advanced-stage axial DON groups, mean GCC global loss volume (GCC GLV) values were 5.3, 2.1, 2.5, 5.5, 4.7, and 3.1 times higher, respectively, than in controls (3.51 ± 2.73%, P < 0.001). In diabetic papillopathy, anterior ischemic DON, degenerative-stage axial DON, advanced-stage axial DON, mild-stage axial DON, and subclinical-stage DON groups, mean GCC focal loss volume (GCC FLV) values were 21.7, 20.5, 17.3, 13.4, 10.3, and 7.5 times higher, respectively, than in controls (0.70 ± 0.81%, P < 0.001).
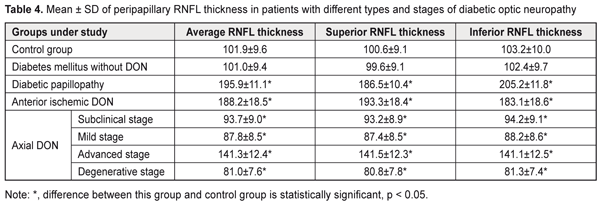
In DM patients without DON, mean GCC thickness, GLV and FLV values were not significantly different from those in controls (P > 0.05). In diabetic papillopathy, anterior ischemic DON, and advanced-stage axial DON groups, mean peripapillary retinal nerve fiber layer (RNFL) thickness values were 92.2%, 84.7%, and 38.7% higher, respectively, than in controls (101.9 ± 9.6 μm, P ˂ 0.001), whereas in subclinical-stage DON, mild-stage axial DON, and degenerative-stage axial DON groups, mean peripapillary retinal nerve fiber layer (RNFL) thickness values were 8.0% (P < 0.05), 13.8% (P ˂ 0.001), and 20.5% (P ˂ 0.001) lower, respectively, than in controls (Table 4). In anterior ischemic DON, diabetic papillopathy, and advanced-stage axial DON, mean superior quadrant RNFL thickness values were 92.1%, 85.4%, and 40.7% higher, respectively, than in controls (100.6 ± 9.1 μm, P ˂ 0.001), whereas in subclinical-stage DON, mild-stage axial DON, and degenerative-stage axial DON groups, mean superior quadrant RNFL thickness values were 7.4% (P < 0.05), 13.1% (P ˂ 0.001), and 19.7% (P ˂ 0.001) lower, respectively, than in controls.
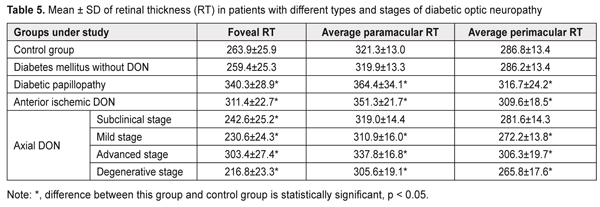
In diabetic papillopathy, anterior ischemic DON, and advanced-stage axial DON, mean inferior quadrant RNFL thickness values were 98.8%, 77.4%, and 36.7% higher, respectively, than in controls (103.2 ± 10.0 μm, P ˂ 0.001), whereas in subclinical-stage DON, mild-stage axial DON, and degenerative-stage axial DON groups, mean inferior quadrant RNFL thickness values were 8,7% (P < 0.05), 14.5% (P ˂ 0.001), and 21.2% (P ˂ 0.001) lower, respectively, than in controls. In DM patients without DON, mean peripapillary RNFL thickness, superior quadrant RNFL thickness and inferior quadrant RNFL thickness values were not significantly different from those in controls (P > 0.05). In diabetic papillopathy, anterior ischemic DON, and advanced-stage axial DON, mean foveal retinal thickness values were 29.0%, 18.0%, and 15.0% higher, respectively, than in controls (263.9 ± 25.9 μm) (P ˂ 0.001), whereas in subclinical-stage DON, mild-stage axial DON, and degenerative-stage axial DON groups, mean foveal retinal thickness values were 8,1% (P < 0.05), 12.6% (P ˂ 0.001), and 17.8% (P ˂ 0.001) lower, respectively, than in controls (Table 5).
In DM patients without DON, mean foveal retinal thickness values were not significantly different from those in controls (P > 0.05). In diabetic papillopathy, anterior ischemic DON, and advanced-stage axial DON, mean paramacular retinal thickness values were 13.4%, 9.3%, and 5.1% higher, respectively, than in controls (321.3 ± 13.0 μm), whereas in mild-stage axial DON and degenerative-stage axial DON groups, mean paramacular retinal thickness values were 3.2% and 4.9% (P ˂ 0.05) lower, respectively, than in controls. In addition, in diabetic papillopathy, anterior ischemic DON, and advanced-stage axial DON, mean perimacular retinal thickness values were 10.4% (P ˂ 0.001), 7.9% (P ˂ 0.001), and 5.1% higher (P ˂ 0.05), respectively, than in controls (286.8 ± 13.4 μm), whereas in mild-stage axial DON and degenerative-stage axial DON groups, mean perimacular retinal thickness values were 5.1% and 7.3% (P ˂ 0.05) lower, respectively, than in controls. In DM patients without DON, mean para- and perimacular retinal thickness values were not significantly different from those in controls (P > 0.05). Therefore, we identified clinical and OCT features of different types and stages of diabetic optic neuropathy. Conclusion First, in diabetic papillopathy, anterior ischemic DON, degenerative-stage axial DON, advanced-stage axial DON, mild-stage axial DON, and subclinical-stage DON groups, mean GCC FLV values were 21.7, 20.5, 17.3, 13.4, 10.3, and 7.5 times higher, respectively, than in controls (0.70 ± 0.81%, P < 0.001). Second, in diabetic papillopathy, anterior ischemic DON, and advanced-stage axial DON groups, mean peripapillary RNFL thickness values were 92.2%, 84.7%, and 38.7% higher, respectively, than in controls, whereas in subclinical-stage DON, mild-stage axial DON, and degenerative-stage axial DON groups, the values were 8.0%, 13.8%, and 20.5% lower, respectively, than in controls. Third, in diabetic papillopathy, anterior ischemic DON, and advanced-stage axial DON, mean foveal retinal thickness values were 29.0%, 18.0%, and 15.0% higher, respectively, than in controls, whereas in subclinical-, mild-, and degenerative-stage axial DON groups, the values were 8.1%, 12.6%, and 17.8% lower, respectively, than in controls.
Finally, in diabetic papillopathy, anterior ischemic DON, and advanced-stage axial DON, mean paramacular retinal thickness values were 13.4%, 9.3%, and 5.1% higher, respectively, than in controls, whereas in mild- and degenerative-stage axial DON groups, the values were 3.2% and 4.9% (P ˂ 0.05) lower, respectively, than in controls. References
|