J.ophthalmol.(Ukraine).2017;4:20-26.
|
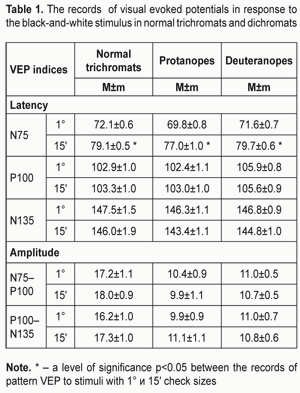
https://doi.org/10.31288/oftalmolzh201742026 Bioelectric activity of the visual system in trichromats and color-blinds according to visual evoked potentials to achromatic and chromatic stimuli N.I.Khramenko, Cand. Sc. (Med), A.V. Ponomarchuk, ophthalmologist, S.B.Slobodianik, Cand. Sc. (Med) Filatov Institute of Eye Diseases and Tissue Therapy of NAMS of Ukraine Odessa (Ukraine) E-mail: khramenkon@mail.ru Background. Psychophysical methods, the most known of which are polychromatic tables and spectral anomaloscope study, are used for diagnostics of color vision defects. However, all these methods are based on the subjective answers of a person, which makes it impossible to use them for certain patients. To date, there have been proposed electrophysiological methods, in particular, a recording of visual evoked potentials (VEP). They are supposed to be of a high diagnostic value. Purpose: to study the bioelectrical activity of the visual system in normal trichromats and red and green color blinds according to visual evoked potentials in response to achromatic and chromatic stimuli. Material and Methods. The study was performed in 17 normal trichromats, 16 red color blinds (protanopes), and 29 green color blinds (deuteranopes). The patients’ age ranged within 17-30 y/o. VEPs were recorded using a RetiScan unit (Roland Сonsult, Germany). Pattern-reversal VEPs were elicited by checkerboard stimuli with black-and-white checks and chromatic checks: red-and-black, R, red (R=255 according to the RGB color chart); green-and-black, G, green (G=200); blue-and-black, B, blue (B=255); and opponent color pairs: red-and-green (R-G) and blue-and-yellow (B-Y). The sizes of the checks used were 1° and 0°15'; reverse frequency was 1.5 Hz; and the pattern contrast was 97%. We recorded amplitudes and latencies of negative waves N75 and N135, and a positive wave P100. Results. Pattern VEP N75, Р100, and N135 latencies in response to black-and-white checkerboard with 1° and 15' checks in protanopes and deuteranopes did not differ from the norm; contrary, N75, Р100, and N135 amplitudes were less than those in normal thrichromats. To chromatic stimuli, N75 latency in persons with color vision defects was almost similar to that in normal trichromats; P100 latency to blue-and-black and red-and-green stimuli was higher than the norm, which was more common for deuteranopes than for protanopes. Generally, the latency values were higher to chromatic stimuli as compared to achromatic ones, except for response to blue-and-yellow stimuli, which were equal. P100 and N135 amplitudes to black-and-white and chromatic stimuli with check sizes 1° and 15' were less in the persons with color vision defects than in normal trichromats. N135 amplitude to black-and-white stimuli with check sizes 1° and 15' was equal to P100 amplitude both in normal trichromats and in the persons with color vision defects. To chromatic stimuli, N135 amplitude was a little higher to stimuli with check size 15' than with check size 1°. Variability coefficient of latency in response to achromatic and chromatic stimuli was 5.9% in normal trichromats, and 6.6% in protanopes and deuteranopes; variability coefficient of amplitude was 38.4% in the norm and exceeded 50% in the persons with vision color defects. Conclusions. Peculiarities of the biological activity of the visual system in red and green color blinds were revealed according to visual evoked potentials. The data obtained make it possible to consider VEP as an objective method for diagnostics of color vision defects and require the following studying. Key-words: color vision,normal trichromacy, protanopy, deuteranopy, visual evoked potentials Background An ability of the eye to distinguish millions of color shades makes it possible for animals and human beings to detect objects and their spatial relationships, which facilitates to the more favorable environmental occurrence and, consequently, survival of the living organism [3]. A theory of color vision emphasizes several stages of the color perception formation in dependence on a) light passage through prereceptoral filters (pupil, lens, deep optical media) and macular pigment; b) light energy absorption by cone photopigments (long-, medium-, and short-wave cones) and nerve impulse conduction by postreceptoral channels of color sensation transmitting (red-green, blue and achromatic channels). The cone photopigments and postreceptoral color channels are known to play the major role in the color perception formation [5]. At the present time, congenital color defects, which affect 8% to10 % of men and 04% to 0.5% of women, are caused by alterations or the absence of one or another receptoral photopigment. The most common defects are deficiencies of color vision within red and green spectra (protan and deutan defects); blue defects are extremely rare registered (one case per tens of thousands) as well as complete loss of color vision (achromatopsias) [5]. There are a variety of methods and techniques for color vision testing. One of them, in particular, polychromatic tables (Rabkin's polychromatic tables, Ishihara plates etc.), have a poor diagnostic accuracy and are best suited for screening detection of the color defect without its specification. Spectral anomaloscope study is more detailed and makes it possible not only to reveal the presence of a color perception defect but also to determine its type (anomalous trichromacy, protanomaly or deuteranomaly, or dichromacy, protanopia or deuteranopia) and degree as well as to detect the acuity of visual perception of three main classes of cones. The anomaloscope study is a standard for accurate diagnostic of congenital defects of green-red cones [1]. However, all these methods being the psychophysical ones are based on the subjective answers of the person, which makes it impossible to use them for certain patients [4]. To date, there have been few studies in which efforts to use electrophysiological methods, in particular, a recording of visual evoked potentials (VEP) to chromatic and achromatic stimuli, have been made [2]. Chromatic VEPs are considered to selectively test the parvocellular visual pathway which is responsible for processing information about colour [6]. However, it is still unknown for sure which cortical sections are responsible for generation of chromatic VEP signal components [2]. The interest to use visual evoked potentials in color vision testing is growing. Over the last years, there have been papers reporting on the high diagnostic value of the method. So, Rabin J.C. et al (2016) believe that chromatic VEP have 100% sensitivity for color vision defect testing and 94% specificity for normal trichromacy confirmation. Purpose: to study the bioelectrical activity of the visual system in response to achromatic and chromatic stimuli according to visual evoked potentials in normal trichromats and red and green color blinds. Material and Methods The study was performed in 17 somatically and ophthalmologically healthy volunteers (normal trichromats), 16 red color blinds (protanopes), and 29 green color blinds (deuteranopes). The patients’ age ranged within 17-30 y/o. Visual evoked potentials (VEP) were recorded using a RetiScan unit (Roland Сonsult, Germany). Pattern-reversal VEPs were elicited by checkerboard stimuli with black-and-white checks and chromatic checks: red-and-black, R, red (R=255 according to the RGB color chart); green-and-black, G, green (G=200); blue-and-black, B, blue (B=255); and opponent color pairs: red-and-green (R-G) and blue-and-yellow (B-Y). The sizes of the checks used were 1° and 0°15'; reverse frequency was 1.5 Hz; and the pattern contrast was 97%. The stimuli were projected on a cathode ray tube with a diagonal of 19?. The testing was monocular for each eye. We recorded amplitudes and latencies of three main components of the pattern-reversal VEP: negative waves N75 and N135, and a positive wave P100. The data obtained were statistically processed using a Student criterion and a nonparametric Mann-Whitney criterion with Statistiсa 8.0 software. Results Black-and-white checkerboard. In normal trichromats, black-and-white pattern VEP parameters to 1° and 15? check sizes in the right and left eyes did not differ statistically and were as follows: N75 latency to 1° and 15? check sizes were 72.1±0.7 ms and 79.1±0.5 ms, respectively, i.e. the latter was higher than the former by 7 ms (9.7% р<0.05). Р100 and N135 latencies were the same to both check sizes and equaled 103±1.0 and 146.8±1.8 ms, respectively. P100 and N135 amplitudes to check sizes 1° and 15? were the same in both eyes and averaged 17.2±1.0 µV (Table 1). Variation coefficient (VC) for all latency records averaged 5.6%, amplitude records were more variable (34.4%). In protanopes, pattern VEP N75 latency to 1° black-and-white check was equal to 69.8±0.84 ms with VC=6.8%, that to 15' check was higher by 10.3% (р<0.05), reaching 76.9±1.0 ms. Pattern VEP P100 latency to 1° and 15' checks averaged 102.7±1.0 ms with VC=6.2% and 5.6%, respectively. In protanopes, black-and-white pattern VEP amplitude of both P100 and N135 was almost the same, not depending on the check size (1° or 15'), and ranged from 9.9±1.1 µV to 11.1±1.1 µV with the mean amplitude of 10.4±1.0 µV for all checks (Table 1).
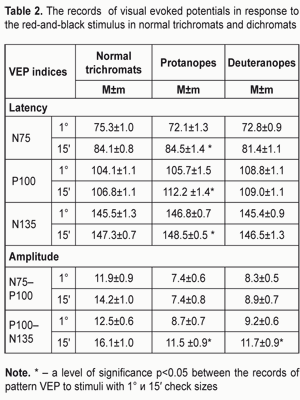
It should be noted than VC of pattern VEP amplitude (55.8%) almost 10 times exceeded VC of latency. In deuteranopes, pattern VEP N75 latency to 15' black-and-white check was by 8.2 ms (14.3%) higher than that to 1° check, р<0.05 (Table 1). The mean P100 and N135 latencies to 1? and 15' check sizes were the same, and equaled, respectively, 105.8 ms and 145.8 ms (Table 1). Both P100 and N135 amplitudes were the same to both check sizes and averaged 10.9 µV. VC of latency and amplitude was 5.6% and 37.5%, respectively. Red-and-black checkerboard. In normal trichromats, pattern VEP latency of negative N75 wave to red-and-black checkerboard stimuli with 1° and 15? checks were 75.3±1,0 ms and 84.1±0,8 ms, i.g. the latter was higher than the former by 8.9 ms (11.8%, р<0.05). P100 latency was the same to both check sizes and equaled 105.5±1.1 ms; N135 latency was 146.4±1.0 (Table 2). P100 amplitude was almost the same to both check sizes and averaged 13.1±1.0 µV. N135 amplitude to 1° and 15? checks were 12.5±0.6 µV and 16.1±1.0 µV, respectively, i.g. the latter was higher than the former by 28.9% (р<0.05).
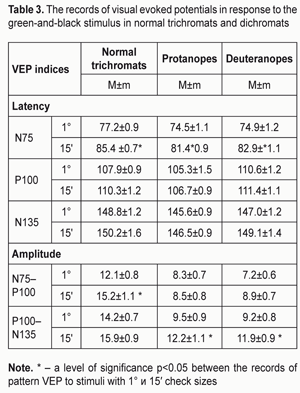
In protanopes, pattern VEP N75 and P100 latency to red-and-black checkerboard with check size 15' was higher by 12.4 ms (7.2%) and 6.5 ms (6.1%), respectively, than those with check size 1°. N135 was the same to 1? and 15' checks and was equal to 147.7 ms. 1? and 15' P100 amplitudes and 1? N135 amplitude were the same and averaged 7.8±0.7 µV and only 15' N135 amplitude was higher by 2.8 µV (32.3%). VC of latency and amplitude was 6.5% and 50%, respectively. In deuteranopes, pattern VEP N75 latency to red-and-black checkerboard with 15' check size was higher by 11.9% higher than that with 1° check size (р<0.05), 81.4±1.1 ms and 72.3±0.9 ms, respectively. P100 and N135 latencies to 1? and 15' check sizes were the same and equaled, respectively, 109 ms and 145.9 ms. 1? P100 and N135 amplitudes were the same and averaged 8.8 µV while 15' N135 amplitudes was 11.7±0.9 ms, i.e. higher by 27.3%. Variability of latency averaged 7.3 % vs. 49.2% of amplitude. Green-and-black checkerboard. In normal trichromats, pattern VEP N75 latency to green-and-black checkerboard stimuli with 1° and 15? checks were 77.2±0.9 ms and 85.4±0.7 ms, i.g. the latter was higher than the former by 10.7% (р<0.05). P100 and N135 latencies were the same to both check sizes and equaled 109.1±1.0 ms and 149.5±1.9, respectively (Table 3). P100 amplitude to 1° and 15? checks were 12.1±0.8 µV and 15.2±1.1 µV, respectively, i.g. the latter was higher than the former by 25.7%. N135 amplitude was the same to both check sizes and averaged 15.1±0.8 µV.
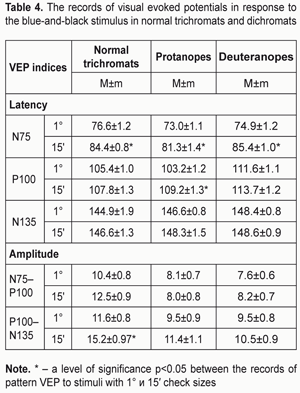
In protanopes, pattern VEP N75 latency to green-and-black checkerboard with check size 1° was 74.5±1.1 ms vs. 81.4±0.9 of that to 15' check (the difference was 9.3%). P100 latency was the same to both check sizes and averaged 106±1.2 ms; N135 latency was also the same, 146.1±0.9 ms. Latency coefficient of variability averaged 5.7%. 1° and 15' P100 amplitudes and 1° N135 amplitude were the same and averaged 8.8±0.8 µV. N135 amplitude was higher to check size 15' than to 1° by 30% (Р<0.05), 12.2±1.1 µV and 9.5±0.9 µV, respectively. VC of amplitude almost ten times exceeded VC of latency, reaching 52.3%. In deuteranopes, pattern VEP N75 latency to green-and-black checkerboard with check size 15' was longer by 10.6% than that with check size 1° (р<0.05), 74.9±1.2 ms and 82.9±*1.1 ms, respectively. P100 and N135 latencies to 1? and 15' check sizes were the same and equaled, respectively, 111 ms and 148 ms. (Table 3). 1? P100 and N135 amplitudes were the same and averaged 8.4 µV while 15' N135 amplitude was higher by 2.7 µV. Variability of latency and amplitude was 7.9% and 53.9%, respectively. Blue-and-black checkerboard. In normal trichromats, pattern VEP N75 latency to blue-and-black checkerboard stimuli with 1° and 15? checks were 76.6±1.2 ms and 84.4±0.8 ms, i.g. the latter was higher than the former by 10.2% (р<0.05). P100 and N135 latencies were the same to both check sizes and equaled 106.6±1.2 ms and 145.8±1.6, respectively. P100 amplitude averaged 11.5±0.9 µV. 1° N135 amplitude was 11.6±0.8 µV and that to check size 15? was higher by 3.6 µV (by 31.3%) (Table 4).
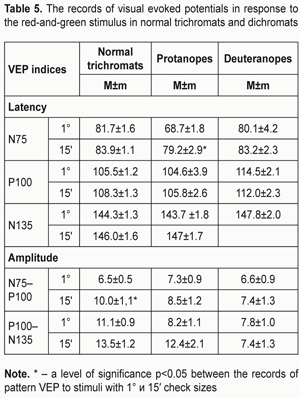
In protanopes, pattern VEP N75 and P100 latencies to blue-and-black checkerboard with check size 15' exceeded those to check size 1°, respectively, by 8.3 ms (11.3%) and 6.1 ms (5.9%). N135 latency was 147.5 ms to both check sizes. The mean amplitude was 9.3 µV for all waves; the highest value of amplitude was of N135 (15?) equaling 11.4±1.1 µV. VC of latency and amplitude was 6.7% and 53.3%, respectively. In deuteranopes, pattern VEP N75 latency to check size 15' was also longer by 14% than that to check size 1° (р<0.05), 74.9±1.2 ms and 85.4±1.0 ms, respectively. P100 and N135 latencies to 1? and 15' check sizes were the same and equaled, respectively, 112.7 ms and 148.5 ms. P100 and N135 amplitudes were the same and averaged 8.9 µV to both check sizes. Variability of latency and amplitude was 6.9% and 59.2%, respectively. Red-and-green checkerboard. In normal trichromats, the respond to red-and-green checkerboard stimuli was characterized by similar latency of all waves to both check sizes, averaging: 82.8±1.4 ms for N75, 145±1.5 for N135, and 106.9±1.3 for P100 (Table 5). Latency VC was 6.3%. P100 amplitude to check 15' was higher than to 1°, 10±1.1 µV and 6.5±0.5 µV, respectively, (р<0.05). 1° and 15' N135 amplitudes did not differ significantly and averaged 12.3±1.1 µV. Amplitude VC was 44.9%. In protanopes, pattern VEP N75 latency to red-and-green checkerboard with check size 15' equaled 79.2±2.9, which was 15.3% higher than the response to 1° check, 68.7±1.8 ms. P100 and N135 latency was the same to both check sizes and averaged 105.2 ms and 145.4 ms, respectively. P100 and N135 amplitudes to both check sizes were almost the same and averaged 9.1 µV. The highest value of amplitude was of 15' N135, equaling 12.4±2.1 µV (Table5). VC of latency and amplitude was 7.9% and 46.8%, respectively.
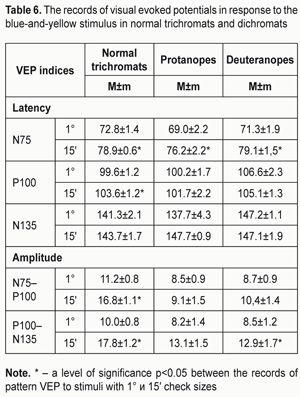
In deuteranopes, pattern VEP N75, P100, and N135 latencies was equal to both check sizes and averaged 81.7 ms, 113.3 ms, and 147.8 ms, respectively. P100 and N135 amplitudes were the same and averaged 7.3 µV. Variability of latency and amplitude was 9.6% and 55.3%, respectively. Blue-and-yellow checkerboard. In normal trichromats, pattern VEP N75 latency to blue-and-yellow checkerboard stimuli was longer to check size 15' than to 1° by 8.4%, 83.9±1.1 ms and 81.7±1.6 ms, respectively. P100 latency to check sizes 15' and 1° was 108.3±1.3 ms and 105.5±1.2 ms, respectively, i.e. the latter was less by 3.9% than the former (Table 6). It should be noted that the latency values of all waves to the response to blue-and-yellow checkerboard were similar to those to achromatic stimulation (Table 1 and 6). N135 latency in blue-and-yellow stimulation was the same to both check sizes and averaged 142.5±1.9 ms. Latency VC was 6.3%. P100 and N135 amplitudes were higher to check 15' than to 1° by 5.4 µV (50%) and 7.8 µV (78%), respectively (Table 6). Amplitude VC was 37.4%.
In protanopes, pattern VEP N75 latency to blue-and-yellow checkerboard with check size 15' equaled 76.2±2.2, which was 10.4% higher than the response to 1° check, 69.0±2.2 ms (р<0,05). P100 and N135 latency was the same to both check sizes and averaged 100.9 ms and 145.2 ms, respectively. 1° and 15' P100 and 1° N135 amplitudes were similar and averaged 8.6 µV while 15' N135 amplitude was higher by 59.8%, equaling 13.1±1.5 µV. VC of latency and amplitude was 7.2% and 44.3%, respectively. In deuteranopes, pattern VEP N75 was longer by 10.9% to blue-and-yellow checkerboard with check size 15' than 1°: 79.1±1.5 ms and 71.3±1.9 ms, respectively. P100, and N135 latencies was equal to both check sizes and averaged 106.1 ms, and 147.2 ms, respectively. P100 and N135 amplitudes were the same and averaged 7.3 µV. Variability of latency and amplitude was 9.6% and 55.3%, respectively. 1° and 15' P100 and 1° N135 amplitudes were similar and averaged 9.2 µV while 15' N135 was higher, reaching 12.9±1.7 µV. VC of latency and amplitude was 6.3% and 47.6%, respectively. Thus, considering the data on visual evoked potentials to achromatic and chromatic stimuli, we can conclude the following: Normal trichromats 1. N75, P100, and N135 latencies are equal to all colored and black-and-white checkerboard stimuli; N75 is higher by 8.8% in response to a smaller check (15'). 2. Pattern VEP amplitude to chromatic 1°and 15? checkerboard is less than to black-and-white checkerboard by 49.6% and by 17%, respectively. 3. Variability of latency and amplitude is similar for achromatic and chromatic stimuli, 5.9% and 38.4%, respectively. Protanopes 1. Pattern VEP N75 latency to achromatic and all chromatic checkerboard stimuli with check size 1° was similar while that was higher by 8.7 ms (12.3%) to check size 15'; N75 latency to black-and white and blue-and-yellow checkerboards with 15' checks averaged 76.6 ms while that was higher by 5 ms (6.5%) to other chromatic stimuli, equaling 81.6 ms. 2. P100 latency was equal, 103.9 ms, to all stimuli except for response to red-and-black and blue-and-black checkerboard stimuli that was higher by 6.2 ms (6%) reaching 110.7 ms; N135 latency was the same to all stimuli and equaled 146.1 ms. 3. P100 and N135 amplitudes were similar to achromatic and chromatic stimuli with check sizes 1° and 15' and averaged 8.6 µV, which was twice less than the same values of response to black-and-white stimulation in normal trichromats; no difference was found between responses to chromatic stimuli. 4. N135 amplitude in response to all checkerboard stimuli with check size 15' was higher by 3.2 µV (37.2%) than those with check size 1°. 5. Variability coefficient of pattern VEP latency was the same to all stimuli and averaged 6.6%; and that of amplitude was 50.4%, which was higher than the same parameter in normal trichromats by 12%. Deuteranopes 1. N75 latency to achromatic and chromatic checkerboard stimuli with check size 1° was similar end equaled 74.3 ms; that was higher by 7.7 ms (10.3%), when check size was 15', and equaled 81.95 ms. 2. 1° and 15' P 100 latency to all stimuli was within the normal range, 109.6 ms; however, it was less to achromatic and blue-and-yellow checkerboard stimulation than to other chromatic stimuli by 5.7 ms (5.4%), 105.8 ms and 111.5 ms, respectively. 3. N135 latency was 147.2 ms to all stimuli. 4. P100 and N135 amplitudes to black-and white stimuli with 1° and 15' checks was the same and equal to 10.9 µV. 5. 1° and 15' P100 amplitudes and 1° N135 amplitude was the same, 8.42 µV, which is less than the response to achromatic stimulus by 2.5 µV (22.8%); 15' N135 amplitude in response to chromatic checkerboard stimuli (red-and-black, red-and-green, blue-and-yellow) was higher by 3.8 µV and reached 12.2 µV. 6. Variability coefficient of latency in response to achromatic and chromatic stimuli averaged 6.34%; VC of amplitude to achromatic stimuli with check sizes 1° and 15' averaged 37.5 % vs. 53.04% of that to chromatic stimuli. Conclusions
The peculiarities of the biological activity of the visual system in red and green color blinds were revealed according to visual evoked potentials. The data obtained make it possible to consider VEPs as an objective method for diagnostics of color vision defects and require the following studying. References
|