J.ophthalmol.(Ukraine).2017;4:9-13.
|
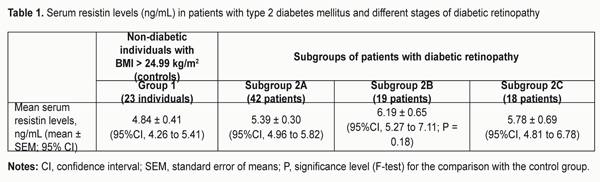
https://doi.org/10.31288/oftalmolzh20174913 Association between serum resistin level and diabetic retinopathy in obese patients with type 2 diabetes mellitus N.V. Malachkova1, Cand Sc (Med), M.L. Kyryliuk2, Dr Sc (Med), Prof., I.V. Komarovska1, Post-grad Student 1Pirogov National Medical University, Vinnytsia, Ukraine 2Department of Neuroendocrinology, Ukrainian Research Center for Endocrine Surgery, Transplantation of Endocrine Organs and Tissues of Ministry of Public Health of Ukraine, Kyiv E-mail:natali.malachkova@mail.ru Background: Diabetic retinopathy (DR) is a leading cause of blindness in developed countries. Factors like inadequate glycemic control, hypertonia, blood lipid disorder, and renal disease, are known to negatively affect vision, and may cause loss of sight. Some studies demonstrate that there are additional contributors to the development of DR. Purpose: To investigate the relationship between serum resistin levels and diabetic retinopathy in obese patients with type 2 diabetes mellitus (T2DM). Materials and Methods: Seventy-nine patients (mean age, 59.57 ± 4.01 years; mean duration of diabetes, 9.97±2.46 years; mean HbA1c, 10.31±1.89%) with T2DM and body mass index (BMI) > 24.99 kg/m2 underwent examination. Serum resistin levels were measured by ELISA. Analysis of variance was used for data analysis. Results: The serum resistin levels were 4.84 ± 0.41 ng/mL (95% CI, 4.26 to 5.41) in the non-diabetic control group and gradually increased with the severity of DR to the maximum of 6.19 ± 0.65 ng/mL (95% CI, 5.27 to 7.11) in moderate to severe non-proliferative DR (P = 0.18). Conclusion: Patients with proliferative DR and any risk factors had moderately increased mean serum resistin levels, with the highest values being noted in duration of diabetes of more than 10 years. Key-words: type 2 diabetes mellitus, obesity, diabetic retinopathy, resistin Introduction An increasing body of evidence has shifted our view of adipose tissue from a passive energy depot of triglycerides to a dynamic "endocrine organ" that produces biologically active substances (including lipocytokines and adipokines) important for energy metabolism. Adipocytes are known today to secrete proteins like tumor necrosis factors (TNFs), adipsin, plasminogen activator inhibitor-1, leptin, resistin and adinopectin. Adipose tissue regulates insulin sensitivity via the circulating TNFs and adipokines (resistin and adinopectin). Adinopectin and resistin have an effect on tissue insulin sensitivity and may be mediators in obesity-induced insulin resistance and type 2 diabetes mellitus (T2DM) [1]. In addition, serum resistin levels have been found to correlate with the severity of microangiopathies and with accumulation of the number of factors related to the metabolic syndrome in T2DM [2, 3]. However, the literature is not consistent on the role of resistin in the pathogenesis of diabetic retinopathy in T2DM. The study purpose was to investigate the relationship between serum resistin levels and diabetic retinopathy in obese patients with T2DM. Materials and Methods The study involved 102 patients (167 eyes) divided into two groups. Group 1 (controls) consisted of 23 obese individuals (both male and female subjects; mean age, 56.17 ± 4.79 years) without T2DM and with body mass index (BMI) > 24.99 kg/m2, whereas Group 2 consisted of 79 patients (both male and female subjects; mean age, 59.57 ± 4.01 years; mean duration of diabetes, 9.97±2.46 years; mean HbA1c, 10.31±1.89%) with T2DM and BMI > 24.99 kg/m2. Inclusion criteria for group 1 were age > 18 years and BMI > 24.99 kg/m2. Inclusion criteria for group 2 were age > 18 years, T2DM, diabetic retinopathy and BMI > 24.99 kg/m2. Exclusion criteria were endocrine or body-system abnormalities leading to obesity; acute infectious disease; type 1 diabetes mellitus; cancer; comorbidity decompensation; mental disorder; administration of neuroleptics or antidepressants; proteinuria; clinically significant maculopathy; optic nerve disorder; glaucoma and cataract. The study followed the tenets of the Declaration of Helsinki of the World Medical Association, 2008. HbA1c levels and type of glycemic control therapy were considered as modifiable risk factors, whereas patient’s age and duration of diabetes were considered as non-modifiable risk factors. Type 1 glycemic control treatment included diet plus metformin, type 2 glycemic control treatment included diet plus metformin and oral glycemic control agents, whereas type 3 glycemic control treatment included a combination of diet, metformin and insulin therapy. HbA1c levels were determined by high-performance liquid chromatography. Given the mean age and expected life duration of the patients, the target HbA1c level was < 8.0% (a stricter criterion of 7 to 7.5% is associated with the risk of hypoglycemic events) [4]. Serum resistin levels were measured spectrophotometrically with an ELISA reader (Labsystems iEMSReader MF, Helsinki, Finland) using DRG Human Resistin ELISA Kit (DRG International, Inc., Mountainside, NJ). Serum resistin level was considered normal if it was ? 0.1 ng/L and ? 10.0 ng/m, as per the manufacturer’s instructions. Ophthalmologic examination included visual acuity, tonometry, Humphrey perimetry, biomicroscopy, ophthalmoscopy, Goldmann contact lens fundus examination, OCT, fundus camera examination and photography. In addition, fluoresceing angiography was performed, if required. Retinopathy was graded according to the Diabetic Retinopathy Disease Severity Scale (Wilkinson et al. 2003). Based on this classification, patients with DR were subdivided into the three subgroups: mild non-proliferative DR (Subgroup 2A), moderate to severe non-proliferative DR (Subgroup 2B), and severe proliferative DR (Subgroup 2C). ANOVA was used for statistical comparison. Data were analysed using Kruskal-Wallis test or Fisher’s exact test (for parametric and non-parametric data respectively). Statistical data are presented as mean ± SEM and 95% confidence interval (CI). A P < 0.05 was considered as significant. Statistical analysis was performed using SPSS 9.0 (SPSS Inc., Chicago, IL, USA). Results and Discussion Table 1 presents mean serum resistin levels in T2DM patients with different stages of DR and in obese controls without T2DM. It should be noted that mean serum resistin levels in all groups were within reference ranges for patients with T2DM and did not exceed upper limit of normal. One-way ANOVA showed no statistical difference in mean serum resistin levels among T2DM patients with different stages of DR and obese controls without T2DM. The serum resistin levels were 4.84 ± 0.41 ng/mL (95% CI, 4.26 to 5.41) in the control group and gradually increased with the severity of DR to 6.19 ± 0.65 ng/mL (95% CI, 5.27 to 7.11) in Subgroup 2B (Table 1).
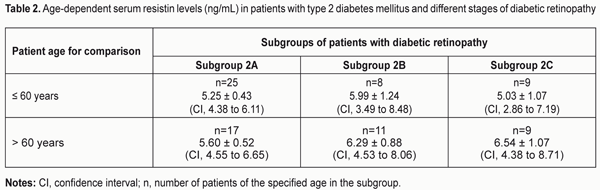
We performed a post-hoc two-way ANOVA to test for the effects of patient’s age, duration of diabetes, HbA1C level and type of glycemic control therapy; the results of this test are presented below. No age-related significant difference in mean serum resistin levels and their confidence intervals among patients with different stages of DR was noted, although worst (maximum) values for mean serum resistin levels (and their CIs) among patients aged 60 and below were noted in patients of Subgroup 2B, whereas among patients aged above 60, they were observed in patients of Subgroup 2C. Best (minimum) values for mean serum resistin levels (and their CIs) among patients aged 60 and below were observed in patients of Subgroup 2C, and worst (maximum) values for mean serum resistin levels (and their CIs) among patients aged above 60 were observed also in patients of Subgroup 2C (Table 2).
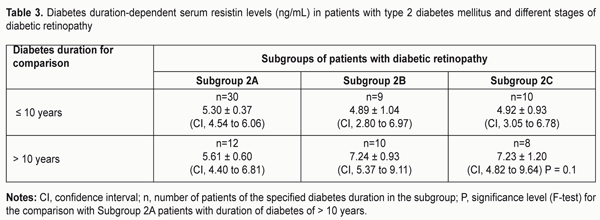
Maximum values for mean serum resistin levels (and their CIs) among patients with duration of diabetes of 10 years or less than were observed in patients of Subgroup 2A, whereas among patients with duration of diabetes of more than 10 years, they were noted in patients of Subgroups 2B and 2C. The highest mean serum resistin levels among patients with duration of diabetes of more than 10 years were noted in patients of Subgroups 2B and 2C (Р = 0.1), whereas the best (lowest) levels among patients with duration of diabetes of 10 years or less were seen in patients of Subgroup 2B (Table 3).
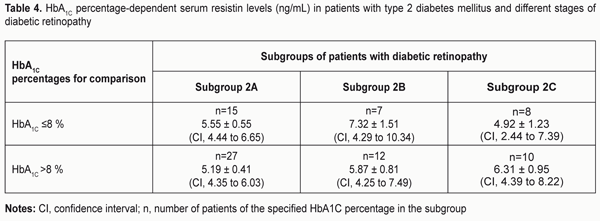
Higher mean serum resistin levels (and their CIs) among diabetic patients with HbA1C ? 8% were observed in patients of Subgroup 2B, whereas among diabetic patients with HbA1C > 8% they were observed in patients of Subgroup 2C (Table 4). The worst (highest) mean serum resistin level among patients was observed in patients with HbA1C ? 8% of Subgroup 2B, whereas the best (lowest) was observed in patients with HbA1C > 8% of Subgroup 2C (Table 4).
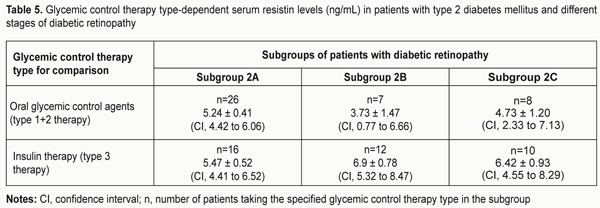
The highest mean serum resistin levels among diabetic patients taking oral glycemic control agents occurred in Subgroup 2A, and the highest mean serum resistin levels among diabetic patients taking insulin were noted in Subgroup 2B (Table 5). The worst (highest) mean serum resistin level was observed in Subgroup 2B patients taking insulin, whereas the best (lowest) level was observed in Subgroup 2B patients taking oral glycemic control agents only.
A hormone named adipocyte-secreted factor, or resistin, is secreted by adipocytes and has been found in mice and human serum. Resistin/FIZZ3 is a member of the newly discovered cysteine-reach secretory protein family, referred to as “resistin-like molecules” (RELM) or “found in inflammatory zone” (FIZZ), together with FIZZ1/ RELM-? and FIZZ2/RELM-?. Both resistin and FIZZ1/RELM-? have been identified in adipose tissue. In addition, resistin has been identified in white adipose tissue, with the highest adipin levels found in gonadal adipose tissue [5]. Initial studies in rodents suggested that resistin is upregulated in obesity and may be involved in the development of insulin resistance [6]. Resistin acts to inhibit adipocyte differentiation, and may function as a feedback regulator of adipogenesis. Injection of mice with resistin has been shown to result in increased blood glucose levels. Resistin, therefore, also functions as a regulator of glucose homeostasis and a physiologic antagonist to hepatic insulin action [7]. Hence, the hormone was initially called “resistin” due to its involvement in the development of insulin resistance [8]. At the same time, a number of studies revealed no significant correlation between plasma resistin levels in humans and insulin sensitivity, BMI, blood pressure or dyslipidemia [9], which advocates for further research on the role of adipose tissue hormones in the pathogenesis of DR. Our analysis of the hormonal predictors (like resistin, an adipose tissue-specific hormone) of diabetic retinopathy development revealed that patients with mild non-proliferative DR had somewhat higher serum resistin levels than controls, with mean serum resistin levels in all risk groups being within reference ranges for patients with T2DM. Patients with moderate to severe non-proliferative DR had somewhat higher mean serum resistin levels (and respective CIs) than those with mild non-proliferative DR. In addition, compared to those with mild non-proliferative DR, they had worse resistin values in 6 risk factors out of 8, with maximum resistin values being within reference ranges for patients with T2DM and noted in duration of diabetes of more than 10 years (7.24 ± 0.93 ng/mL) and in HbA1C ?8 % (7.32 ± 1.,51 ng/mL). Patients with proliferative DR had elevated mean serum resistin levels (and respective CIs) compared to controls and to those with mild non-proliferative DR. Moreover, compared to those with moderate to severe non-proliferative DR, they had worse resistin values in 4 risk factors, with maximum resistin values being within reference ranges for patients with T2DM and noted in duration of diabetes of more than 10 years (7.23 ± 1.20 ng/mL). We could not find any data in the literature regarding the physiological range of serum resistin levels (reference values or 95% CI-adjusted values), which makes interpretation of the serum resistin values (e.g., found in our study) difficult. Sch?ffler et al [10] have reported on resistin serum concentrations measured by ELISA in 216 healthy controls, 555 patients with type 2 diabetes and 114 patients with type 1 diabetes (0.6 ng/ml up to 27.7 ng/ml; in our study, these values were taken as reference values, whereas serum resistin level was considered normal if it was ? 0.1 ng/L and ? 10.0 ng/m, as per the manufacturer’s instructions). Mean values, median, and range were determined, and BMI-, gender-, and disease-adapted percentiles were calculated for all subgroups. Those authors [10] demonstrated that age and gender did not have any influence on resistin levels. BMI and resistin levels were positively correlated in healthy controls (p = 0.02), albeit with a weak correlation coefficient. In the study reported here, we found no direct correlation between serum resistin levels and stages of DR. Given the data presented above, we believe that this is due to the fact that all our healthy controls and all patients (irrespective of severity of DR) had BMI > 24.99 kg/m2. In addition, we believe that percentiles (confidence interval) may provide additional help in interpreting the results of serum resistin level measurements. In order to elucidate a pathogenetic mechanism of the relationship between serum resistin levels and presence of DR in T2DM, Naglaa et al [11] measured fasting serum resistin and C-reactive protein (CRP) levels in thirty obese diabetic subjects (with different grades of retinopathy: ten diabetic patients without retinopathy, ten diabetic patients with non-proliferative retinopathy and ten diabetic patients with proliferative retinopathy) and compared them with the results of ten obese non diabetic subjects and ten non obese healthy volunteers. They used simple regression analysis involving retinopathy stage as a dependent variable and serum resistin as an independent variable and found that serum resistin was signi?cantly correlated with the stage of retinopathy. Hence, serum resistin level rather highly correlates with CRP level (an inflammation marker), which confirms the role of resistin in the inflammatory process and explains the relationship between resistin and retinopathy. Similar results have been observed in other studies, both in vivo [12] and in vitro [13]. Conclusions Type 2 diabetic patients with moderate to severe non-proliferative DR, especially those with duration of diabetes of more than 10 years or with HbA1C ?8 %, demonstrated the highest mean serum resistin levels.
Patients with proliferative DR and any risk factors had moderately increased mean serum resistin levels, with maximum values being noted in duration of diabetes of more than 10 years. References
|