J.ophthalmol.(Ukraine).2017;3:43-47.
|
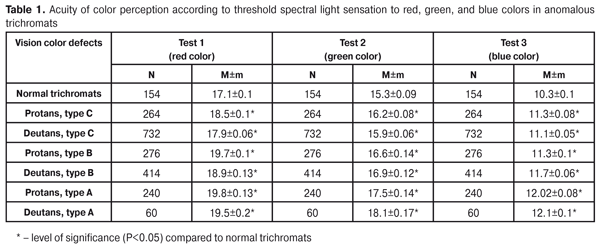
https://doi.org/10.31288/oftalmolzh201734347 Spectral light sensitivity and anomalous quotient in anomalous trichromats with protanomaly and deutanomaly A. V. Ponomarchuk N.I. Khramenko Background. An ability to precisely distinguish red and green colors is crucial for many professions, which has conditioned the importance of color vision diagnostics and its application in vocational selection. Background An ability to precisely distinguish red and green colors is crucial for many occupations in military, transport (air, marine, auto, rail), chemical, polygraphic, textile, and other industries [1]. The first color vision standards for transport occupations were implemented 100 years ago. Since then, experts have developed new lanterns and signs according to medical requirements to color. The special requirements have been addressed to professional flight crews and color assessment and diagnosis tests have been developed as standards for pilots [2]. Currently, the prevalence of color vision deficiency in European Caucasians is about 8% in men and about 0.5% in women and 3% to 4% and 3% in population of Chinese and Japanese ethnicity, respectively [3]. One of the color vision diagnostic methods is a spectral test using the anomaloscope. An AN-59 anomaloscope is designed for detecting trichromatic and dichromatic color vision as well as the acuity of color perception, spectral light sensitivity. The acuity of color perception is detecting according to thresholds, i.e minimal differences in colors which can be distinguished by the visual system [4]. The purpose of the present study was to detect the acuity of color perception according to anomaloscope data on spectral light sensitivity in threshold testing the main classes of cones as well as the anomalous quotient in anomalous trichromats of various severity. Material and Methods The study was performed in anomalous trichromats with emmetropic refraction and visual acuity of 1.0. A group of protanomalous patients: type C, 132 persons (264 eyes); type B, 138 persons (276 eyes); type A, 120 persons (240 eyes). A group of deutanomalous patients: type C, 366 persons (732 eyes); type B, 207 persons (414 eyes); type A, 30 persons (60 eyes). 77 normal trichromats without concomitant ocular and systemic diseases served as Control. The patients aged 16 to 33 years. The acuity of color perception was determined using the AN-59 anomaloscope with three tests: 1 (red), 2 (green), and 3 (blue) colors in a mode of graded color differences. The final diagnosis was made using a comprehensive examination with Rabkin’s polychromatic table, Yustova's threshold table, the anomaloscope. Anomalous quotient (AQ) was calculated using AN-59 anomaloscope data (ma) according to formula: AQ=0.91(ma /70- ma) [1] Anomalous quotient >0.7 confirms abnormal red color vision and AQ >1.3 confirms abnormal green color vision. Results The anomaloscope examination showed that, in normal trichromats, threshold spectral light sensitivity was highest to red color (test 1), lower by 10.5% to green color (P<0.05) (test 2) compared to red, and lowest to blue color (test 3), 17.1±0.1 RUs, 15.3±0.09 RUs, and 10.4±0.1 RUs, respectively, (P<0.05) (Table 1).
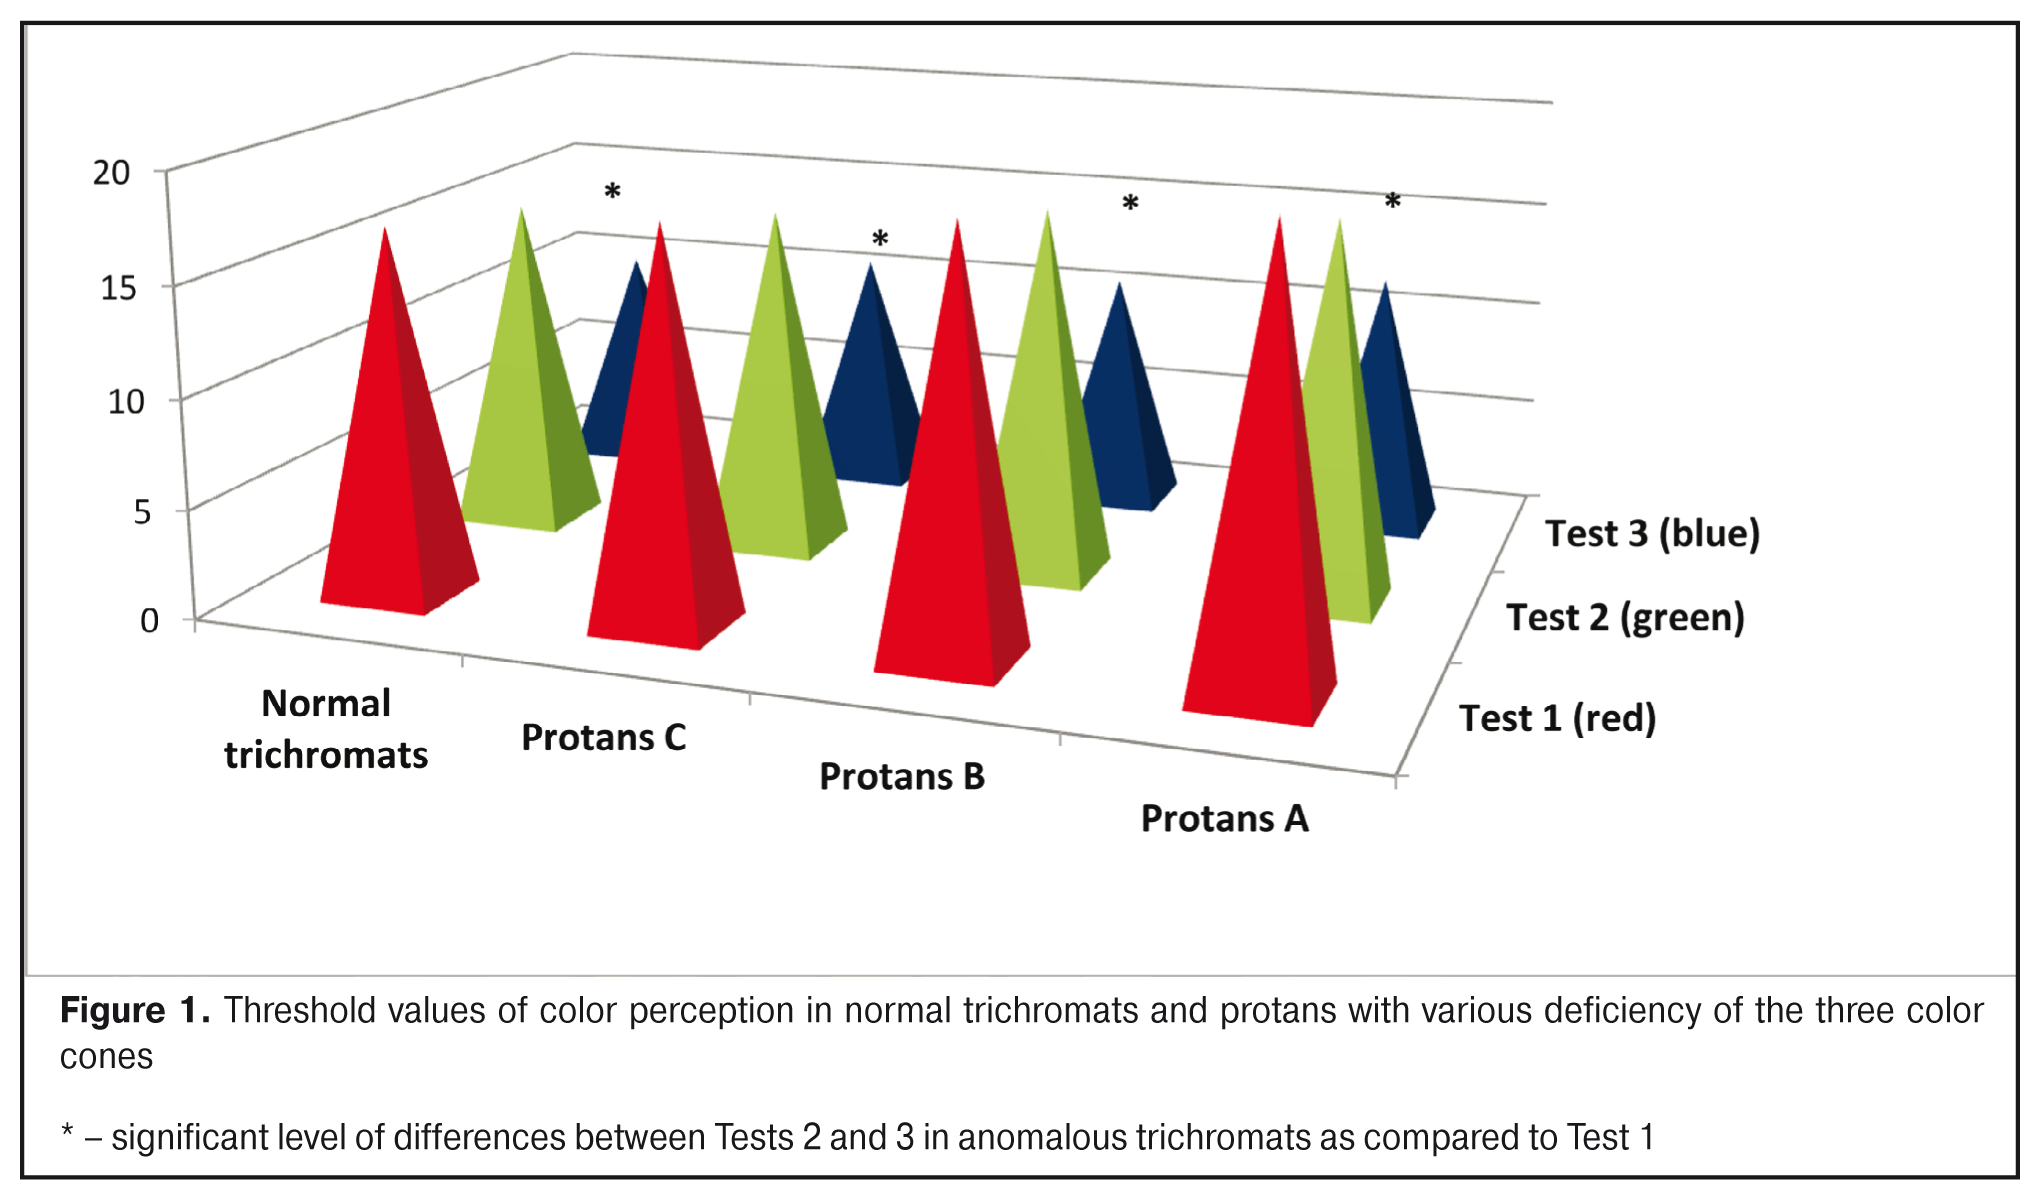
In group of patients with type C protanomaly, with mild red color defects, red color perception was 18.5±0.1 RUs and varied from 15 to 25 RUs; the lowest color perception threshold was to green color, 16.2±0.09 RUs, which was by 13.5% lower (Р<0.05) compared to red color; blue color perception was 11.4±0.08 RUs and varied from 9 to 12 RUs, which was by 40.5% lower than red color threshold (P<0.05) (Tab. 1, Fig. 1).
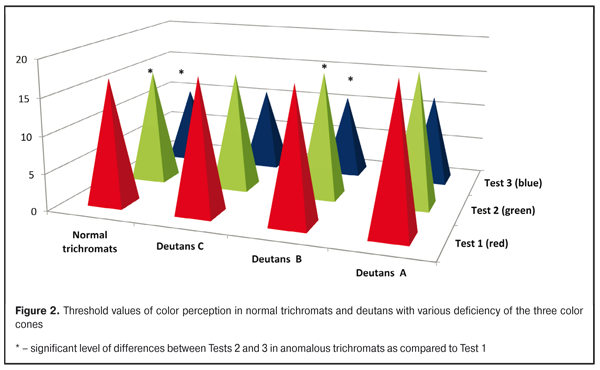
In group of patients with type C deuteranomaly, with mild green color defects, threshold perception to red color was 17.8±0.07 RUs and varied from 10 to 24 RUs; that to green color was 15.9±0.06 RUs, varying from 10 to 23 RUs, which was by 11.2% lower (Р<0.05) compared to red color; that to blue color was 11±0.05 RUs and varied from 6 to 16 RUs (Tab. 1, Fig. 2)
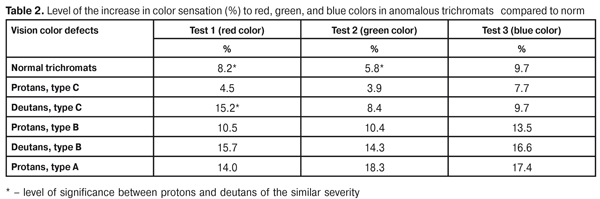
Thus, in mild anomalous trichromats, the highest threshold of red color perception was in protans, 18.5 RUs, which was higher than in deutans by 0.7 RUs; the highest threshold of green color perception was in protans, 16.2 RUs, which was higher than in deutans by 0.39 (2.2%); threshold of blue color perception was the same in all type C anomalous trichromats and equaled 11 RUs (Table1). In group of patients with type B protanomaly, with moderate red color defects, threshold of perception of red color was 19.7±0.15 RUs varying from 16 to 28 RUs; green color perception threshold was 16.6±0.1 RUs varying from 14 to 23 RUs, which was by 13.3% lower (Р<0.05) compared to red color; blue color perception threshold was 11.3±0.09 RUs and varied from 5 to 17 RUs, which was by 44% lower than red color threshold (Fig. 1). In group of patients with type B deuteranomaly, with moderate green color defects, threshold perception of red color was 19±0.1 RUs and varied from 18 to 33 RUs; that to green color was 16.9±0.1 RUs, varying from 10 to 35 RUs, which was by 10.7% lower (Р<0.05) compared to red color; that to blue color was 11.8±0.06 RUs, which was by 38% lower (Р<0.05) compared to red color (Tab. 1, Fig. 2) Thus, in moderate anomalous trichromats, the higher thresholds of perception of red color were more common in protans, they were higher than in deutans by 0.8 RUs (3.7%) (P<0.05); perception of green and blue colors did not differ significantly between anomalous trechromats of this severity (Table1). Subjectively, 14 % of protans and 4.8 % of deutans did not name red color correctly; green and blue colors were correctly named by everyone. In anomalous trichromacy of type A, with severe color vision defects, color perception threshold were equally increased in all three colors in all anomalous trichromats. Red, green, blue color perception thresholds averaged 19.5 RUs, 18.1 RUs, and 12.0 RUs, respectively. Sensitivity of the visual system to red color was lower than to green and blue colors, by 10% and 39.3% (P<0.05), respectively, in all severe anomalous trichromats. In group of type A trichromacy, subjective misperception of red color was revealed in 35.1% of protans and in 11.8% of deutans. These patients perceived it as green or yellow colors, i.e. as middle-wave part of the spectrum. Misperception of green color was revealed in 8.8% and 20.6%, respectively, pointing it as grey or yellow. When comparing the level of significance in thresholds in anomalous trichromats, the increased thresholds were noted even in mild color vision defects (to 9.7%) as compared to norm; the increase is more expressed in severe color vision defects (to 18.3%) in all three colors (Table 2).
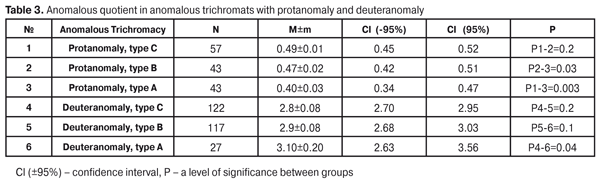
Studying the abnormality of color vision On studying the acuity of color perception, we determined the anomalous quotient according to A test, which is based on a Rayleigh color measurement test designed by Rayleigh in 1881, where red and green colors to be mixed in a certain ratio to match a basic yellow color. Abrupt deviation in the ratio occurs in anomalous trichromats. An ability to match the yellow half of the field of the anomaloscope to the second half of the field, which the patients adjust using the mixture of red and green colors, indicated the presence or absence of normal trichromacy. Normal ranges of Rayleigh equation were 31±0.01 RUs. A decreased value of the green-red ratio in matching the right half of the field to the left yellow half of the field made it possible to diagnose protanomaly: the value of Rayleigh equation, in this case, was <31 RUs while it was > 31 RUs in the presence of deutanomaly. On the data obtained, we calculated the anomalous quotient which in norm ranged from 0.7 to 1.3 RUs. In all protanomalous trichromats, AQ was significantly decreased as compared to the norm and the AQ values ranged from 0.49 in mild protonomaly (C type) to 0.4 in severe protanomaly (A type) (Table 3). AQ in moderate (B type) and severe (A type) protanomaly was lower than in mild protanomaly (C type) by 4.1% (р<0.05) and 18.3 % (р<0.05), respectively (Table 3).
In all deutanomalous trichromats, AQ was twice as high as the norm and the AQ values ranged from 2.8 to 3.1 depending on the severity of color vision deficiency. In severe deutanomaly, the AQ values were higher by 10.7% (р<0.05), comparing to other groups (Table 3). Thus, one of the important characteristics of the spectral anamoloscope is the possibility to detect color vision trichromathy and severity of color vision defects which is characterized by the anomalous quotient. AQ was significantly decreased in protanomalous trichromacy, as compared to the norm, and ranged from 0.34 to 0.52, with a notable reduction by 18.3% in severe protanomaly, with confidence interval of 95%. Contrariwise, in the presence of deutanomalous trichromacy, AQ was greatly superior to the norm, ranging from 2.63 to 3.56 and reaching the maximal value (higher than other groups by 10.7%) in severe deutanomaly. In protanomalous and deutanomalous trichromacy, spectral light sensitivity, which characterizes the acuity of color perception, is disordered. This function is afflicted as color vision defects get more severe and the loss in perception of red, green, and blue colors can reach up to 18.3% in severe color vision defects. Conclusions 1. Threshold color perception according to the anomaloscope data was highest and lowest when distinguishing blue and red colors, respectively, in both normal and anomalous trichromats. Blue, green, and red color thresholds averaged 10.3 RUs, 15.3 RUs, and 17.1 RUs, respectively, in normal trichromats. 2. The most expressed decrease in the acuity of color perception was in anomalous trichromats of type A, from 14% to 18.3%, while the least expressed decrease was in type C abnormality, from 3.9% to 9.7%, in all three colors.
3 Spectral abnormality is characterized by the anomalous quotient. In protanomalous trichromats, AQ ranged from 0.34 to 0.52, with the decrease by 18.3 in the severe form: type C AQ =0.49±0.01 vs. type A AQ=0.40±0.03. In deutanomalous trichromats, AQ ranged from 2.63 to 3.56, with the increase by 10.7 in the severe form: type C AQ =2.8±0.08 vs. type A AQ=3.10±0.20. References
|