Primary open-angle glaucoma progression depending on clinical indices at presentation
S.Iu. Mogilevskyy1, Dr Sc (Med), Prof.S.V. Ziablitsev2, Dr Sc (Med), Prof.
L. I. Denisiuk1, Assistant
1Ophthalmology Department, Shupik National Medical Academy of Postgraduate Education,
2Pathophysiology Department, Bohomolets National Medical University
Kyiv, Ukraine
E-mail: sergey.mogilevskyy@gmail.com
Background: Given the importance of developing simple and efficient methods for the diagnosis and prognosis of primary open-angle glaucoma (POAG), we have previously proposed an index of progression of glaucoma stage (IPGS).
Purpose: To investigate associations between progression of POAG and clinical indices at presentation.
Materials and Methods: The study group comprised 172 patients (78 men (45%) and 94 (55 %) women; mean age at presentation, 57.3±1.1 years) diagnosed with POAG. POAG stage was graded by the Nesterov and Bunin classification of 1975 well as by the Hodapp classification based on the results of the ophthalmological observation of patients over two years. IPGS was calculated as a percentage ratio of (a) a sum of ranked POAG stages and IOP values (categories of IOP) at baseline and study time points and (b) difference between age and disease duration, expressed in years. Sex, age, duration of disease, stage of POAG at presentation, and category of IOP at presentation (IOP0) were input variables used in multiple logistic regression model building.
Results: The IPGS index clearly represented both the change in POAG stages over time and progression of the disease. Age (r = -0.468), disease duration (r = 0.695), stage of POAG (r = +0.805) and IOP category (r= +0.735) correlated more significantly than did other variables with IPGS. Patient sex was not correlated with IPGS (r=-0.169; p = 0.027). The equation for predicting IPGS estimates based on characteristics at presentation was developed through multiple regression:
"IPGS=35.311-0.521?A+2.512?D+3.913?S+4.191?C"
where IPGS is index of progression of glaucoma stage; A, patient age; D, disease duration; S, POAG stage; C, IOP category.
In terms of the relative impact of the predictors on the IPGS, IOP category had the strongest influence (? = 4.191±0.446), followed by stage of POAG at presentation (? = 3.913 ± 0.356); disease duration (? = 2.512 ± 0.313) and patient age (? = -0.521 ± 0.022). The developed equation is characterized by a significant effect of the combination of independent variables on the dependent variable (R=+0.965 (F=562.35, P<.0001); adjusted R2=+0.931).
Conclusion: Amongst predictors, IOP category had the strongest influence, while patient age had the weakest influence on the IPGS. The equation for prediction of IPGS can be proposed as early as at presentation and will allow the clinician to conduct individualized treatment of patients.
Key words: primary open-angle glaucoma, index of progression of glaucoma stage
Introduction
Primary open-angle glaucoma (POAG) is a severe ocular disorder and a leading global cause of blindness and incapacitation [1-3]. The global number of persons with POAG, estimated at more than 44 million in 2010, is expected to rise to 58.6 million by 2020. In 2014, glaucoma was one of the most common (15%) incapacitating ocular conditions in Ukraine, although the figure was insubstantially lower than the figure of 2013 [4]. This may be due to the fact that, in the recent five years, increased attention has been paid in the local ophthalmological community to the disease, leading to somewhat improved early diagnosis and management of this common pathology. The prevalence of glaucoma in Ukraine in persons aged 18 or older in 2014 was 601.9 per 100,000 persons, corresponding to 212516 totally [5].
Given the attention of Ukrainian ophthalmological community to the diagnosis and prognosis of the disease in this time of economic hardships in our country, developing simple and conventional criteria which enable the clinician to reliably predict pathologic course is important [6]. We have found previously that index of progression of glaucoma stage (IPGS) can be considered such a criterion [7].
The study purpose was to investigate associations between progression of POAG and clinical indices at presentation.
Materials and Methods
The study group comprised 172 patients (78 men (45%) and 94 (55 %) women) diagnosed with POAG, and the control group comprised 98 individuals (46 men (47 %) and 52 women (53 %)) without POAG. The mean age of patients was 57.3±1.1 years at the time of detection of POAG. At baseline, complaints were collected and detailed histories were taken, and patients underwent visual acuity testing, Humphrey perimetry, pneumotonometry, refractometry, biomicroscopy, gonioscopy, ophthalmoscopy and ocular coherence tomography (OCT). POAG stage was graded by the Nesterov and Bunin classification of 1975 [2] as well as by the Hodapp classification based on baseline examination. As per the Hodapp classification, in early, moderate and severe glaucomatous loss, mean deviation (MD) was less than -6 dB (corresponding to the first stage), less than -12 dB (corresponding to the second stage), and greater than -12 dB (corresponding to the third and fourth stages), respectively. The examination above was conducted at baseline, 12 months and 24 months.
For the purpose of generalization of data on changes in POAG stages over two years, patients were ranked by IPGS that was calculated using the equation:
where Stage0, Stage1 and Stage2 are stages at baseline, 1 year and 2 years, respectively; IOP0, IOP1 and IOP2 are ranked IOP values (categories of IOP) at baseline, 1 year and 2 years, respectively; and DD is disease duration.
Our index (IPGS) takes into account the patient age and disease duration at baseline, changes to the next stage over time, and IOP values at study time points. The index values are expressed as a percentage. IOP categories were defined as per protocol [2, 8]: normal (category 1, up to 23 mmHg); moderately elevated (category 2, 23 mmHg to 32 mmHg); and elevated (category 3, 33 mmHg and above). An IPGS index of 100% is consistent with a patient of young age (25 years) with stage IV POAG and elevated (category 3) IOP at baseline and over the two year observation period, and a DD of 4 years.
Sex, age, duration of disease, stage of POAG at presentation, and category of IOP at presentation (IOP0) were input variables used in multiple logistic regression model building. Statistical analysis was performed using MedCalc v.15.11.0 (MedCalc Software bvba, 1993–2015).
Results and Discussion
Patient observation over two years revealed an increase in the stage of glaucomatous loss (p < 0.001) in eyes of the study. Pairwise comparisons (multiple comparisons of dependent samples [9]) revealed an increase in the number of eyes with more advanced glaucoma stages at year 1 and year 2 compared with baseline (p < 0.05 in both cases) as well as an increase in this index at year 2 compared with year 1 (p < 0.05).
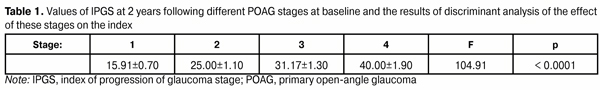
Table 1 shows IPGS estimates obtained for different stages of POAG. IPGS estimates statistically significantly increased with an advance in the severity of the pathological process (i.e., advance in the stage of the disease). Dispersion analysis was conducted to evaluate the effect of the index on the distribution of POAG stages at the initial phase of the supervision and revealed that the IPGS estimates clearly depended on the stage of POAG (p = 0.002). Therefore, the IPGS index (a) clearly represents both the change in POAG stages over time and progression of the disease, and (b) its use is reasonable for further analysis.
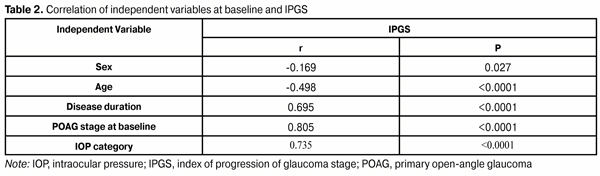
Correlation analysis was conducted to find the variables that significantly correlated with IPGS (Table 2). As age (r = -0.468), disease duration (r = 0.695), stage of POAG (r = +0.805) and IOP category (r= + 0.735) correlated more significantly than did other variables with IPGS, they were selected as predictors for further analysis. Patient sex was not correlated with IPGS (r=-0.169; p = 0.027), and was not used for further analysis.
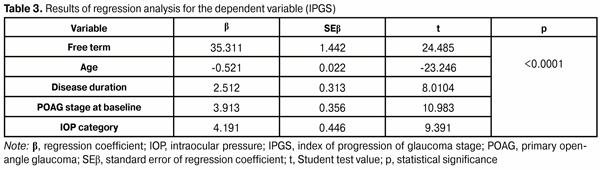
Multiple logistic regression analysis was used to develop an equation for prediction of IPGS based on baseline characteristics; the results of the analysis are presented in Table 3. The regression coefficients (or ? coefficients) represent the independent contributions of each independent variable to the prediction of the dependent variable. Their analysis showed that, in terms of the relative impact of the predictors on the IPGS, IOP category had the strongest influence (? = 4.191±0.446), followed by stage of POAG at presentation (? = 3.913 ± 0.356); disease duration (? = 2.512 ± 0.313) and patient age (? = -0.521 ± 0.022).
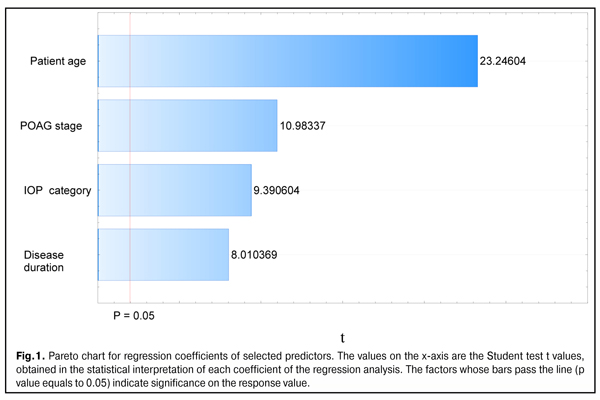
The magnitudes and significance of the estimated regression coefficients of selected predictors are shown in the Pareto chart (Fig. 1). The chart confirms that IOP category has the highest magnitude of effect, whereas patient age has the lowest magnitude of effect in our multiple regression model for predicting IPGS in patients with POAG.
Regression analysis demonstrated a significant effect of the combination of independent variables on the dependent variable (F=562.35, P<.0001). The R was +0.965, indicating that approximately 96.5% of the variance in IPGS was accounted for by the combination of independent variables in the model. In addition, the model fit was excellent (adjusted R2 = +0.931).
Therefore, the obtained results allowed us to present the equation for calculating IPGS in the following way (equation 2):
were IPGS is index of progression of glaucoma stage; A, patient age; D, disease duration; S, POAG stage; C, IOP category
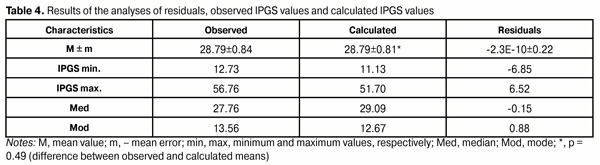
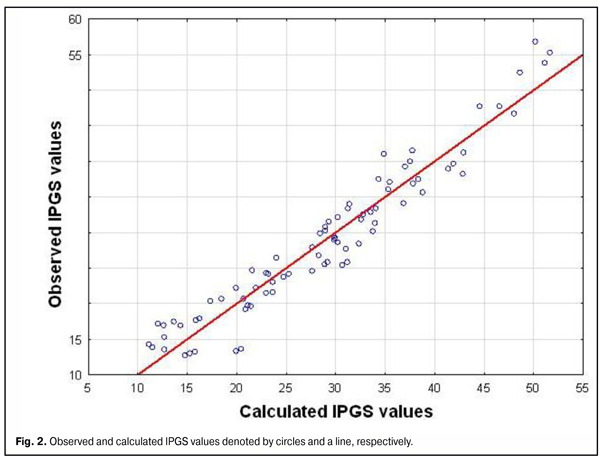
Table 4 demonstrates the residuals (predicted with the use of equation (2) minus observed IPGS values). Maximum and minimum residuals of IPGS values did not exceed +6.52 and -6.85, respectively. The difference between mean IPGS values was not significant (р = 0.49). Figure 2 shows the scatter plot of predicted versus observed IPGS for the multiple regression model.
Conclusions
First, correlation and regression analyses demonstrated that, in terms of the relative impact of the predictors on the IPGS, IOP category had the strongest influence (? = 4.191±0.446), followed by stage of POAG at presentation, disease duration and patient age. Second, an equation was developed for calculation of IPGS, with a significant effect of the combination of independent variables on the dependent variable (R=+0.965 (F=562.35, P<.0001); adjusted R2=+0.931).
References
1. Zavgorodniaia NG, Pasechnikova NV. [Primary glaucoma: A new look at an old problem]. Zaporizhzhia: Orbita-YUG; 2010 Russian
2. Nesterov AP. [Glaucoma]. Moscow: Meditsinskoye Informatsionnoye Agenstvo; 2008 Russian
3. Varma R, Peeples P, Walt JG. Disease progression and the need for neuroprotection in glaucoma management. Am J Manag Care. 2008 Feb;14(1 Suppl):S15-9
4. SI Cherniak, editor. [Main 2014 annual indices of disability and activity of medical-and-social expert commissions of Ukraine. Information and analytical reference book]. Dnipropetrovsk: Aktsent Private Enterprise; 2015. 167 p. Russian
5. Golubchikov MV, Rykov SO, Vitovska OP, et al. [Ophthalmological care in Ukraine in 2005-2014. Analytical and statistical reference book]. Kyiv: Logos; 2015. 230 p. Ukrainian
6. Kurysheva NI. [Glaucomatous optic neuropathy]. Moscow: MEDpressinform; 2006. Russian
7. Mogilevskyy SIu, Denisiuk LI. [Association of TP53 Pro72Arg polymorphism and primary open-angle glaucoma in patients of the Ukrainian population]. Visnyk problem biolohii i medytsyny. 2016; 3(2):40-3. Ukrainian
8. Flammer J. Glaucoma – a guide for patients, an introduction for care providers, a quick reference. Bern: Huber; 2001
9. Conover WJ. Practical nonparametric statistics (3rd edn). New York: John Wiley & Sons; 1999