J.ophthalmol.(Ukraine).2016;4:33-37.
|
https://doi.org/10.31288/oftalmolzh201643337 The incidence and prevalence of diseases of the eye and its adnexa in adult population of Sumy region Iu.A. Demin, Dr Sc (Med), Professor O.V. Kusenko, MD E.V. Kuzenko, Cand Sc (Med)1 Kharkiv Medical Academy of Post-graduate Education 1 Medical Institute of Sumy State University Kharkiv, Ukraine E-mail: logvinenok_26@mail.ru We analyzed the incidence and prevalence of selected nosologies of eye diseases. The analysis was conducted among the adult population of Sumy region within 2005 - 2015 years. We observed a reduction in primary incidence by 4.26%, against the background of unstable prevalence rates. Thus, the latter was reduced by 8% from 2005 to 2010, and, afterwards, it rapidly returned to 2005 rates. The first, second and third places in the distribution of the newly diagnosed eye diseases among Sumy region adults took conjunctival diseases, cataract, and keratitis and scleral diseases, respectively. Key words: incidence, prevalence, diseases of the eye and its adnexa, cataract, myopia, optic atrophy, glaucoma. Background The main parameters indicating the level of social and economic development in the state are morbidity and disability. Diseases of the eye and its adnexa take one of the first places among causes leading to blindness in working-age population. Over the last ten years (2001-2010) in Ukraine, there has been an increase in eye pathology indices; thus, eye disease incidence increased by 348.9 per 100 000 of population, and its prevalence rate increased three times [1]. The tendency to increase is also observed in the countries of the near abroad. In Russia, over the last years, disability rate among adult population has increased 1.25 times [2]. In Azerbaijan, its level averaged 9.6 per 10 thousand of adult population [3]. According to World Health Organization (WHO), cataract (47.9%) remains the leading cause of vision loss in the developing countries, vs. age-related macular degeneration, glaucoma, diabetic retinopathy which are more common among the European population. In 1999, WHO and The International Agency for the Prevention of Blindness (IAPB) announced the Global Initiative for the Elimination of Avoidable Blindness called VISION 2020: The Right to Sight to bring the problems of blindness, vision disorders and rehabilitation of people with visual impairment into the world public [4]. Etiology and pathogenesis of eye disease development are variable. Modern researchers put forward anthropogenic environment factors, such as salt of heavy metal [5, 6, 7-9], pesticides [10], electromagnetic field [11, 12], infrasound, noise etc. [13], as a trigger factor for eye disease development. According to the data of Environmental center of the Acdemy of Science of Ukraine, the greatest number of obsolete pesticides (about a half of its total is 1,1,1-trichloro-2,2-di(p- chlorophenyl) and chlorine-containing pesticides) is in Kiev, Sumy, and Vinnytsia oblasts, 2.5, 2.5, and 1.5 thousand tons, respectively [14]. Since technogenic pollution is growing, the issue of estimating relationship between environmental exposure and health status of the population is of the most immediate interest for the modern medicine. Thus, the purpose of our paper was to examine the incidence and prevalence of the diseases of the eye and its addnexa in some nosologies among adult population in Sumy oblast over the period of 2005 to 2015. Material and Methods We analyzed source data, obtained from Regional Information Analytical Center for Health Statistics in the city of Sumy. The data were on levels of prevalence of diseases among adult population according to the International Statistical Classification of Diseases and Related Health Problems (ICD-10) Chapter VII: (H00–H09) Disorders of eyelid, lacrimal system and orbit, H10-H11 (Disorders of conjunctiva), H15-H18 (Disorders of sclera and cornea), Н25-Н26 (Cataract), Н33 (Retinal detachments and breaks), Н40 (Glaucoma), Н47.2 (Optic atrophy), and Н52.1 (Myopia). State statistical reporting form №12 over the period of 2005 to 2015 was used in the study. Mathematical calculations were made by STATISTICA 8 software (Serial number 31415926535898) using Student's t test.
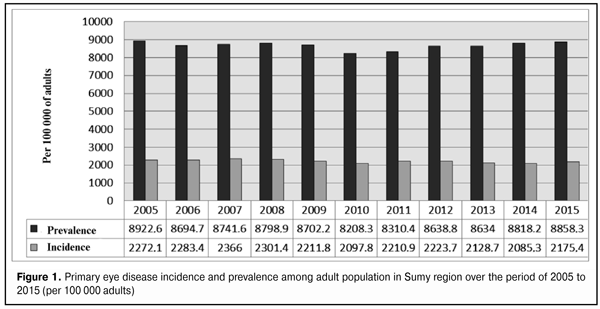
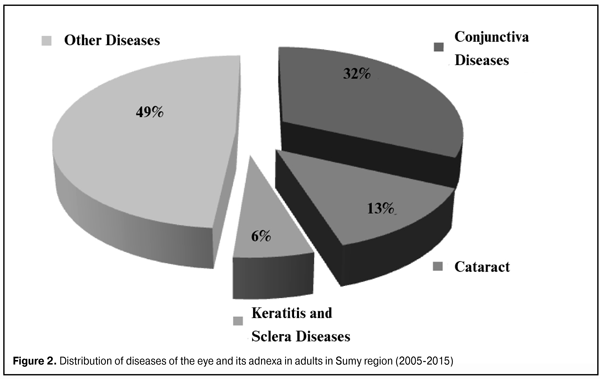
Results and Discussion Using the materials of the official statistics, we analyzed the indices of incidence and prevalence of primary disease of the eye and its adnexa among adult population in Sumy region over the period of 2005 to 2015. Figure 1 demonstrates that over 10-year period, the primary disease incidence indices decreased insignificantly from 2 272.11 in 2005 to 2 175.38 in 2015 (per 100 000 adults). The highest and the lowest rates were noted in 2007 and 2014, respectively, and were 2 365.98 and 2 085.98 per 100 000 adults, respectively. Among all the primary diseases of the eye and its adnexa, a third was comprised by conjunctivitis (31.84%); every seventh had cataract (13.29%) (Fig. 2).
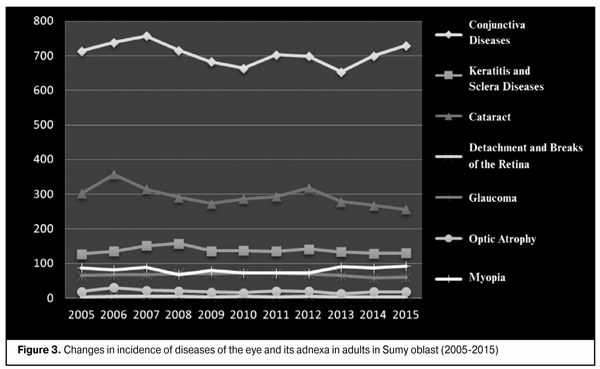
As for the prevalence of ophthalmic pathology, it was of an unstable character; in particular, at the beginning the indices decreased from 8 922.64 in 2005 to 8 208.27 in 2010 per 100 000 adults and then they increased year by year (2001-2015) close to 2005 rates. We analyzed the distribution of eye disease prevalence in adults among 18 districts of Sumy region and determined, in average, districts with the highest and lowest prevalence levels. Thus, thehighest rates were in Lypovodolynskyi, Lebedynskyi and Yampilskyi districts, and the lowest ones were in Okhtyrskyi and Putyvlskyi districts. As for primary disease incidence rates, the leader was Lypovodolynskyi district, which rate was 7 times higher as compared to Shostkynskyi District where the lowest incidence rates were observed. Incidence analysis carried out in terms of various nosological entities showed no significant changes in frequency of primary registration of conjunctiva diseases within 2005 to 2015 years and its incidence ranged between 713 and 729 cases per 100 000 adults (Fig. 3). The highest rates were consistently observed in Yampilskyi Lypovodolynskyi, and Romenskyi districts. The lowest rates were recorded in Shostkynskyi, Hlukhivskyi, and Okhtyrskyi districts, 10-year average. Special mention should go to Sums'kyi and Seredyno-Buds'kyi districts since their average annual growth in level of newly diagnosed conjunctiva diseases were (42.36±12.87) % and (40.64±28.93)%, respectively.
Conversely, conjunctiva disease prevalence rates decreased in most districts (12) as compared to the year of 2005, especially in Hlukhivskyi, Burynskyi, and Velyko-Pysarivskyi where fall was by 71.94%, 42.97%, and 27.09%, respectively. However, in Seredyno-Buds'kyi, Lypovodolynskyi, and Sums'kyi districts prevalence increased by 91.02%, 60.21%, and 54.73%, respectively. Another frequent nosological entity was cataract which was newly diagnosed in 256.23 per 100 000 adults in 2015. Throughout the studying, we observed wavy changes with a common tendency to decrease in incidence rates comparing to the year of 2005. The high disease incidence rates were common for Hlukhivskyi, Lypovodolynskyi, and Lebedynskyi districts. At the same time, the lowest rates as for 2015 were in Yampilskyi and Shostkynskyi districts. Cataract prevalence from 2005 to 2015 increased in twelve districts. The maximum growth rate throughout the period of observation was noted in Seredyno-Buds'kyi and Lebedynskyi districts, i.e. (36.29±27.40%) and (25.47±11.67%), respectively. The minimal growth rate, (4.39±3.69%), was in Konotopskyi district. As for myopia incidence, its dynamics was characterized with a stable tendency to annual increase. Thus, the incidence rate per 100 000 adults was 87.82 in 2007, it increased to 88.48 and 90.16 in 2007 and 2013, respectively, reached 92.60 in 2015. The maximal growth rates were in Okhtyrskyi, Bilopilskyi, and Nedryhailivskyi districts, i.e. by 84.45%, 58.68%, and 55.73%, respectively; the minimal ones were in Yampilskyi and Burynskyi districts, where the incidence rates decreased by 91.45% and 81.78%, respectively. Unlike the incidence, the prevalence rates decreased for myopia. This index in 2015 was lower than that in 2005 by 7.6% due to Shostkynskyi, Yampilskyi, Burynskyi, Velyko-Pysarivskyi, Krolevetskyi, and Lebedynskyi districts. Comparing to the year of 2005, the prevalence rates increased twice in Krasnopilskyi, Okhtyrskyi, Sums'kyi , and Seredyno-Buds'kyi districts. Analyzing the incidence and prevalence for glaucoma, we noted both a decrease in its primary registration by 8.82% (from 65.5 to 59.72 per 100 000 adults) and an increase in its prevalence by 31.38% (from 693.32 to 910.95 per 100 000 adults) within 2005 to 2015. The most significant decrease in glaucoma incidence rates was observed in Velyko-Pysarivskyi and Yampilskyi districts, by 70.14% and 54.14%, respectively. The incidence growth was intensive in Seredyno-Buds'kyi, Lebedynskyi, and Hlukhivskyi districts, (50.6±24.05%), (23.19±15.83%), and (34.13±23.42%), respectively. Consistently high rates of the disease were recorded in almost all districts. The highest glaucoma prevalence rates were observed in Lypovodolynskyi and Lebedynskyi districts, the lowest ones were in Velyko-Pysarivskyi, Bilopilskyi, and Yampilskyi districts. The incidence of newly diagnosed diseases of the sclera and the cornea changed little, if at all, during the whole period and ranged within 127 to 130 cases per 100 000 adults. The average annual increase comprised (12.81±5.93) %. It should be noted that within 2005 to 2015 scleral and corneal disease incidence rates in Romenskyi, Lebedynskyi, and Lypovodolynskyi districts were 10 times higher than those in Konotopskyi, Bilopilskyi, Trostianetskyi, Nedryhailivskyi, and Seredyno-Buds'kyi districts (p<0.05). The prevalence of this group of diseases had the same tendency. The highest rates were noted in Romenskyi, Lebedynskyi, Yampilskyi districts while the lowest ones were in Bilopilskyi, Nedryhailivskyi, and Putyvlskyi districts. Over the last ten years, optic atrophy incidence was of unstable nature with the highest peaks in 2006, 2007, and 2011, i.e. 30.77, 22.59, and 21.09, respectively, per 100 000 adults; the lowest indices were 17.16, 15.86, and 13.19 per 100 000 adults per 100 000 adults in 2009, 2010, and 2013, respectively. As for 2015, this disease incidence was 18.5 per 100 000 adults. The highest rates of the newly diagnosed cases in 2015 were recorded in Hlukhivskyi, Nedryhailivskyi, Burynskyi, and Krasnopilskyi districts, the lowest rates were in Sums'kyi, Konotopskyi, and Bilopilskyi districts. Attention should be drawn to Krolevetskyi district since there was not a single patient with optic atrophy over the last three years (2013 to 2015). The prevalence of optic atrophy (OA) throughout the period increased by 12.13 %: 170.82 in 2005 vs. 194.39 in 2015, per 100 000 adults. OA prevalence rates decreased only in 6 districts, in particular, by 12.2% in Shostkynskyi district and by 72.4% in Bilopilskyi district. In the rest of districts this parameter increased; and the highest rates were in Hlukhivskyi district where average annual growth equaled (22.20±11.75) %. Primary registration of cases with retinal detachment was much variable over the last 10 years. First, we observed incidence growth from 4.03 to 5.9 cases within 2005 to 2010; afterwards it decreased to 3.81 in 2015. Constantly high incidence rates were noted in Burynskyi district, average annual growth of which equaled 14.09%. The prevalence of this pathology, in contrast, increased each year by an average of 5.85%. In 2015, its highest and lowest rates were in Burynskyi and Seredyno-Buds'kyi districts, respectively. Conclusions It was found that over the period from 2005 to 2015 the incidence of the newly diagnosed diseases of the eye and its adnexa decreased in Sumy region’s adults by 4.26 % against the background of unstable prevalence rates which decreased by 8% from 2005 to 2010 and, afterwards, returned rabidly to the 2005 rates. The first, second and third places in the distribution of the newly diagnosed eye diseases among Sumy region adults took conjunctival diseases, cataract, and keratitis and scleral diseases, respectively. As for 2015, the highest rates of eye disease incidence by selected nosologies were recorded in Lypovodolynskyi (diseases of the conjunctiva, keratitis, and sclera diseases, glaucoma), Lebedynskyi (cataract), Hlukhivskyi (optic atrophy), Romenskyi (retinal detachment), and Velyko-Pysarivskyi (myopia) districts. Further research prospects. The high level of eye disease prevalence in industrial districts urges to research the effect of salt of heavy metal on the visual analyzer in experimental animals to determine the etiologic factors and pathogenic mechanisms of eye diseases. References 1.Rykov SO, Vasyuta VA. {Morbidity of eye disease and its additional device, their prevalence among population of Ukraine]. Ukraine. Health of the Nation. 2011; 4 (20):7-11. In Russian. 2.Libman ES. [Medical and social problems in ophthalmology]. IX Congress of Russian Ophthalmologists: thesis abstracts. 16-18 June; Moscow; 2010. P.70-71. In Russian. 3.Kerimov KT, Rustamov NM, Kerimova NK, et al. [Primary disability dynamics due to organ pathology in Azerbaijan Republic]. Oftalmologiya. 2010; 3: 73-77. In Russian. 4.Web-site. VISION 2020 International Agency for the Prevention of Blindness. Available at: http://www.iapb.org/vision-2020. 5.Yablonskaya DA, Mischenko T, Malyshev VV et al. [Complex assessment of visual system changes in chronic mercurial intoxication]. Kubanskii nauchnyi med vestnik. 2011; 1 (124):149-152. 6.Okonenko TI. [Impact of air pollution on morphological state of eyes and crystallographic picture of rats’ eye sclera lavages.] Ekologiia cheloveka. 2013; 9: 24-28. In Russian. 7.Erie JC, Butz JA, Good JA, Erie EA, Burritt MF, Cameron JD. Heavy metal concentration in human eyes. Am J Ophthalmol. 2005 May;139(5):888-893. 8.Yuki K, Dogru M, Imamura Y et al. Lead accumulation as possible risk factor for primary open-angle glaucoma. Biological Trace Element Research.2009;132(1-3):1–8. 9.Park SJ, Lee JH, Woo SJ, Kang SW, Park KH. Five heavy metallic elements and age-related macular degeneration: Korean National Health and Nutrition Examination Survey, 2008–2011. Ophthalmology. 2015 Jan; 122 (1):129-37. 10.Cheremukhina O, Rykov SA. [Functional changes of eye and its adnexa under the influence of pesticides]. Oftalmologiia v Belarusi. 2011; 2 (09): 55-58. In Russian. 11.Akar A, Karayi?it M?, Bolat D, G?ltiken ME, Yarim M, Castellani G. Effects of low level electromagnetic field exposure at 2.45 GHz on rat cornea. Int J Radiat Biol. 2013 Apr; 89 (4):243-9. 12.Behrens T, Lynge E, Cree I, Sabroe S, Lutz JM, Afonso N, Eriksson M, Gu?nel P, Merletti F, Morales-Suarez-Varela M, Stengrevics A, F?votte J, Llopis-Gonz?lez A, Gorini G, Sharkova G, Hardell L, Ahrens W. Occupational exposure to electromagnetic fields and sex-differential risk of uveal melanoma. Occup Environ Med. 2010 Nov; 67 (11):751-9. 13.Batyrshin RA, Gazizova IR. [Сlinical experimental aspects of influence of industrial acoustic vibrations on visual analyzer]. 2007; 3 (4): 71-74. In Russian. 14.[Pesticides: a real danger. Review of non-governmental organizations in the region of Eastern Europe, Caucasus and Central Asia to identify unauthorized stocks of banned and obsolete pesticides]. 2004. Available at: http://ipen.org/sites/default/files/documents/identifying_pesticide_stoc... In Russian.
|