J.ophthalmol.(Ukraine).2016;3:22-27.
|
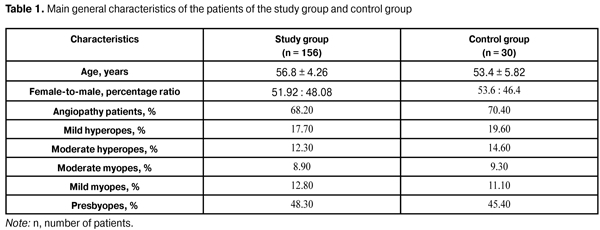
https://doi.org/10.31288/oftalmolzh201632227 Assessment of visual evoked potential characteristics and their relationship with functional parameters in different stages of primary open angle glaucoma L.M. Stotska, Cand Sc (Med) Filatov Institute of Eye Disease and Tissue Therapy Odessa, Ukraine E-mail: odjusa@email.ua Background: Studies of structural and neurophysiological processes in the superior visual system of patients with primary open-angle glaucoma (POAG) help in detecting primary structural lesions in this disorder. Investigation of brain evoked potentials provides the most important information about the processes in the visual cortex, and that of visual evoked potentials (VEP) provides us with the most valuable information. It is neurophysiological studies that often identify the nervous system changes developing during a long silent period before features of clinical disease become evident, which is especially important for early diagnosis of the glaucoma process. Lately, foreign and national ophthalmologists have been paying special attention to the diagnosis of pathologic retinal changes in different stages of POAG. Purpose: To assess VEP characteristics and their relationship with functional parameters in different stages of POAG. Materials and Methods: One hundred and eighty six patients (358 eyes) underwent a clinical and neurophysiological study at the Filatov Institute of Eye Diseases. The study group comprised 156 patients (81 females and 75 males; mean age, 56.8 ± 4.26 years) with different POAG stages, whereas the control group comprised 30 patients without POAG. The RETIscan system (Roland Consult, Wiesbaden, Germany) was used to perform neurophysiological studies (pattern and flash VEP). Results: Compared to controls, preglaucoma and mild-stage POAG patients had statistically significantly increased VEP N75-P100 peak-to-peak amplitude (12.80 ± 4.57 µV (140.6%) and 14.84 ± 3.09 µV (180%), respectively р<0.05), whereas moderate-stage and severe-stage POAG patients had decreased VEP N75-P100 peak-to-peak amplitude (1.61±1.32 µV (69.62%) and 2.34±0.61 µV (55.85%), respectively, р<0.05). The VEP N75, Р100, and N135 latencies in preglaucoma and mild-stage POAG patients were not statistically significantly different from those of controls. The VEP P100 latency in moderate-stage POAG patients was statistically significantly increased (17.12%, р<0.05) compared to controls. Compared to controls, severe-stage POAG patients had statistically significantly increased P100 latency and N135 latency (26.88% and 13.44%, respectively; р< 0.05), and decreased visual system sensitivity (phosphene threshold current) (80.0 ± 8.25 µA; 22.68%; р<0.05). The visual system sensitivity (phosphene threshold current) in patients with preglaucoma, mild- and moderate-stage POAG was within the normal range. In patients with pre-glaucoma, a correlation was found between pattern VEP P100 latency and visual field index (VFI) (rho = 0.11, p < 0.05) as well as between P100-N75 peak-to-peak amplitude and Humphrey mean deviation (MD) (rho = 0.6, p<0.05). No correlation was found between pattern and flash VEP parameters and such clinical parameters as VFI, MD, cup width and intraocular pressure in mild, moderate and severe POAG. Conclusions: Investigation of neurophysiological processes in retinal ganglion cells and the use of VEP in clinical practice are important for the diagnosis of glaucoma before the clinical symptoms manifest. Key words: primary open-angle glaucoma, visual evoked potentials, functional parameters, retina, ganglial cells Introduction Glaucoma is both a disorder resulting in severe irreversible ocular changes and a major cause of blindness worldwide [1-3]. Although it is of the most common and severe ocular diseases worldwide, studies on its diagnosis and pathogenesis are of the most difficult to interpret. Currently, glaucoma is believed to include a number of diseases and conditions, and refers not to a single disease process but to a group of diseases with similar signs [4]. Until recently, decreased visual field, increased intraocular pressure and optic nerve head atrophy have been considered major clinical signs of glaucoma. The disease commonly results in irreversible bilateral loss of vision if left untreated and is the second most common cause of blindness in the world [2]. Although both systemic and local factors are involved in the course of glaucoma, pathophysiological mechanisms of the disorder have not been fully elucidated. Early diagnosis and timely resolution of the risk factors for further development of the disease are a way for the physician to overcome it [3, 5]. Studies of structural and neurophysiological processes in the superior visual system of patients with primary open-angle glaucoma (POAG) help in detecting primary structural lesions in this disorder. Studies on the retina in POAG patients have been given much attention lately. Increased death rate of retinal ganglion cells and their axons, as well as involvement of neuroglia (which ensures nourishment of the optic nerve) into the pathological process are considered the essence of glaucoma process [4-8]. Current clinical examination techniques, scanning laser polarimetry and optical coherence tomography (OCT), are used to confirm structural changes in the retina and optic nerve at various functional levels [9]. Visual evoked potential (VEP) is a neurophysiological technique; although not specific, these techniques make it possible to investigate processes in the visual cortex and at various morphofunctional retinal layers, as well as to identify pathological changes before clinical symptoms manifest, which is critical for investigating the pathogenesis and for early diagnosing [6]. The study purpose was to assess VEP characteristics and their relationship with functional parameters in different stages of POAG. Materials and Methods One hundred and eighty six patients (358 eyes) underwent a clinical and neurophysiological study at the Filatov Institute of Eye Diseases. The study group comprised 156 patients (81 females and 75 males; mean age, 56.8 ± 4.26 years) with different POAG stages, whereas the control group comprised 30 mild or moderate emmetropes (60 eyes) without POAG. Both groups were comparable in terms of age, female-to-male percentage, and presence of other somatic disorders (Table 1). Right and left eyes underwent separate evaluations. Clinical examination included visual acuity assessment; tonometry; tonography; refractometry; biomicroscopy; direct and indirect ophthalmoscopy; ocular rheography; Humphrey perimetry mean deviation (MD) and visual field index (VFI) on the HFA 750 apparatus (Humphrey-Zeiss, San Leandro, CA); examination of visual system sensitivity (phosphene threshold current) and; cup width with SOCT Copernicus (Optopol, Zawiercie, Poland) optical coherent tomography (OCT) system.
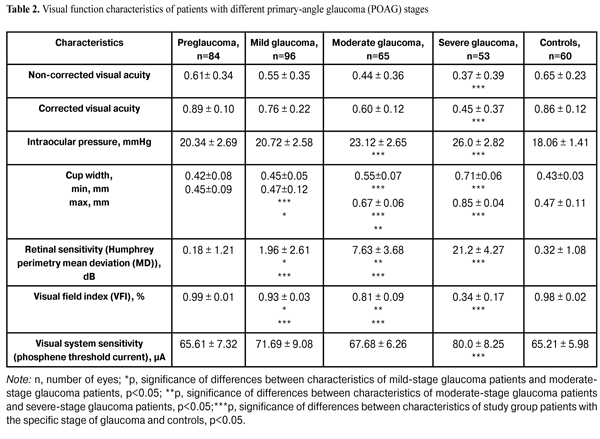
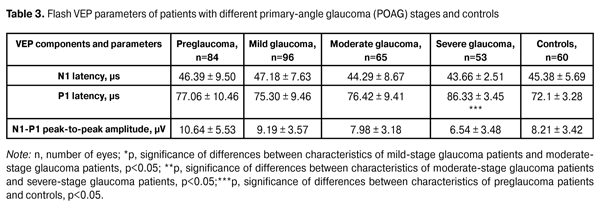
In addition, patients underwent a neurophysiological study involving pattern and flash VEP tests. VEP data were obtained with the multifocal (mf) ERG and VEP RETIscan system (Roland Consult, Wiesbaden, Germany). We recorded changes in (1) pattern VEP latencies of N75, P100, and N135 and amplitudes of N75-P100 and P100-N75, and (2) flash VEP latencies of N1 and P1 and amplitudes of N1-P1 to characterize VEP dynamics and pathological processes. The study group (156 patients; 298 eyes) was retrospectively subdivided into preglaucoma-stage (42 patients; 84 eyes), mild-stage glaucoma (48 patients; 96 eyes), moderate-stage glaucoma (36 patients; 65 eyes), and severe-stage glaucoma (30 patients; 53 eyes) subgroups based on the degree of POAG severity. The preglaucoma subgroup comprised patients with two of the following parameters being abnormal: those of ocular rheography, OCT evidence of inter-eye difference in cup width of more than 20%, inter-eye or daily difference in IOP of more than 3-4 mm, presence of clinically significant POAG in the fellow eye and presence of a genetic history of glaucoma. Exclusion criteria included: absolute glaucoma, high emmetropia, optic nerve disease, macular dystrophy, hypertonic retinopathy, optic media opacity, diabetes mellitus, cranial trauma, and acute and chronic brain circulation disorders. Since no standards for normal values of VEP measurements have been established in clinical practice, VEP data of POAG patients were compared with those of controls as well as with literature data [10] and those supplied by the manufacturers. Statistical analysis was performed with Statistica 10 software (Statsoft, Tulsa, OK) and involved the use of pairwise Student t test and nonparametric Spearman correlation. P < 0.05 was considered significant. Results and Discussion Table 2 presents clinical characteristics of the study group and control group which were used as criteria for the diagnosis and course of the disease. Statistically significant differences in IOP, cup width, and Humphrey parameters were found between patients with moderate and those with severe disease (Table 2). A statistically significant difference between the mild disease subgroup and the moderate disease subgroup as well as between the former and the control group was found only in Humphrey parameters. There were no statistically significant differences in any parameter studied between patients with preglaucoma and those with mild disease, as well as between the former and the controls.
Compared to controls, preglaucoma and mild-stage POAG patients had statistically significantly increased VEP N75-P100 peak-to-peak amplitude (12.80 ± 4.57 µV (140.6%) and 14.84 ± 3.09 µV (180%), respectively, р<0.05), whereas moderate-stage and severe-stage POAG patients had decreased VEP N75-P100 peak-to-peak amplitude (1.61±1.32 µV (69.62%) and 2.34±0.61 µV (55.85%), respectively, р<0.05). Visual system sensitivity (phosphene threshold current) in preglaucoma patients (65.61±7.32 µA) was within the normal range. VEP N75-P100 amplitude to 60’ check size was statistically significantly higher in patients with mild glaucoma (14.84±3.09; 180%) compared to controls (р<0.05). There were no statistically significant differences in N75, Р100, and N135 latencies between these groups. Visual system sensitivity (phosphene threshold current) in patients with mild glaucoma (71.69±9.08 µA) was within the normal range. Compared to controls, moderate-stage glaucoma patients had statistically significantly increased P100 latency (17.12%; р< 0.05), whereas their visual system sensitivity (phosphene threshold current) (67.68 ± 6.26 µA) was within the normal range. Severe-stage glaucoma patients had statistically significantly increased P100 latency (26.88%; р< 0.05) and N135 latency (13.44%; р<0.05), and decreased visual system sensitivity (phosphene threshold current) (80.0 ± 8.25 µA; 22.68%; р < 0.05) compared to controls. Spearman correlation was used to analyze relationships between main clinical and VEP characteristics. In patients with pre-glaucoma, a positive correlation was found between P100 latency and visual field index (VFI) (rho = 0.11, p < 0.05), as well as between P100-N135 amplitude and retinal sensitivity measured with the Humphrey perimetry (MD) (rho = 0.6, p = 0.01). No statistically significant correlation was found between VEP characteristics and such clinical parameters as VFI, cup width and IOP, in patients with mild, moderate and severe-stage glaucoma. Given (1) the above data, (2) the changes in pattern VEP parameters over time as early as at the initial stages of pathological process, (3) the absence of abnormal values of flash VEP parameters and visual system sensitivity (phosphene threshold current) at pre-, mild and moderate glaucoma stages, and (4) the morphology of VEPs to flash stimulus and pattern reverse checker board, one can conclude that the changes in pattern VEP parameters in POAG eyes are consistent with pathological processes in the gangliocytes of the third retinal neuron. As the pathological process progresses, the abnormality of the values of certain characteristics related to the gangliocytes of the third retinal neuron increases, thus evidencing the pathogenetic nature of these changes. Presence of correlation between pattern and flash VEP parameters and such clinical parameters as characteristic changes in VFI and MD in pre-glaucoma indicates the involvement of neurophysiological abnormalities of retinal gangliocytes in the development of early glaucoma. Absence of correlation between pattern and flash VEP parameters and such clinical parameters as characteristic changes in VFI, MD, and cup width in mild, moderate and severe POAG, indicates that abnormal neurophysiological changes in retinal ganglial cell bodies are more advanced than the pathological changes in the retina and optic nerve, resulting in the changes in the above clinical diagnostic parameters. Conclusions First, based on the pattern VEP data, we identified changes in neurophysiological parameters which characterize the process occurring in retinal ganglial cell bodies at different stages of POAG. Second, it was found that, compared to controls, preglaucoma and mild-stage POAG patients had statistically significantly increased pattern VEP N75-P100 peak-to-peak amplitude (140.6% and 180%, respectively; p < 0.05), whereas moderate-stage and severe-stage POAG patients had decreased pattern VEP N75-P100 peak-to-peak amplitude (69.62% and 55.85%, respectively; p < 0.05). Third, in patients with pre-glaucoma, a correlation was found between pattern VEP P100 latency and VFI (rho = 0.11, p < 0.05) as well as between P100-N75 peak-to-peak amplitude and MD (rho = 0.6, p < 0.05). Fourth, incorporation of pattern VEP studies into clinical practice is of importance for the diagnosis of glaucoma before the clinical symptoms manifest. Finally, incorporation of neurophysiological studies into clinical practice would enable ophthalmologists to establish the basis for (1) identification of patients at risk for the development of glaucoma and (2) early monitoring of patients with POAG. References
|