Mathematical analysis of the effect of Pro72Arg polymorphism in the TP53 gene on the emergence and progression of POAG
S.Iu. Mogilevskyy1, Dr Sc (Med), Prof.,
S.V. Ziablitsev2, Dr Sc (Med), Prof.,
L. I. Denisiuk1, Assistant,
V.G. Gur’ianov2, Cand Sc (Physics and Math)
1Ophthalmology Department, Shupik National Medical Academy of Postgraduate Education, Ministry of Public Health of Ukraine
2Bohomolets National Medical University
E-mail: inna.sister@mail.ru
Background: Elevated intraocular pressure (IOP) is a major risk factor for primary open-angle glaucoma (POAG). Increased attention is also given to activation of apoptosis of retinal ganglion cells which results in the development of glaucomatous neuropathy and is regulated by p53. An association between the TP53 polymorphism and POAG has been reported previously.
Purpose: To analyze mathematically the effect of the Pro/Arg72 polymorphism in the TP53 gene on the emergence and progression of POAG.
Materials and Methods: The study group comprised 172 patients diagnosed with POAG, and the control group comprised 98 individuals without POAG. Patients underwent ophthalmological examination and Disc Damage Likelihood Scale (DDLS) grading for stage of POAG at baseline, 12 months and 24 months. Stage of POAG at presentation (Y1), IOP category at presentation (Y2), change in POAG stage over two years (Y1D) and change in IOP category over two years (Y2D) were the output variables, whereas sex, age, duration of disease, genotype, stage of POAG at presentation, and category of IOP at presentation (IOP0) were independent (input) variables used in multiple logistic regression model building. Polymorphic variants of TP53 gene were determined by real-time PCR using a TaqMan®SNP Genotyping Assay (Life Technologies, Grand Island, NY). Statistical analysis was performed using MedCalc v.15.11.0 (MedCalc Software bvba, 1993–2015).
Results: The analysis revealed associations between the severity of the pathological process (measured as stage of POAG at presentation) and disease duration, and between the severity and disease genotype. Patients with p53 Pro72Arg genotype had higher odds of a severe stage of POAG compared to those with Pro72Pro genotype (p=0.01, OR = 3.5 (95 % CI=1.3-9.5). In addition, patients with p53 Arg72Arg genotype had higher odds of developing a severe stage of POAG compared to those with Pro72Pro genotype (p=0.04, OR = 3.2, 95 % CI=1.1-9.7). There were associations between the IOP category at presentation and age, disease duration and genotype: patients with p53 Arg72Arg genotype had higher odds of a more advanced IOP category compared to those with Pro72Arg or Pro72Pro genotype (p=0.04, OR = 2.64; 95 % CI=1.04-6.67). An association was also revealed between the changes in POAG stage over two years and disease duration: the odds of developing a severe stage of POAG increased more than twofold with each 1-year increase in duration of disease (p < 0.001). Men had 2.3 times lower odds of developing a more advanced category of IOP compared with women (p = 0.035).
Conclusion: A relationship was revealed between the emergence of POAG and Pro72Arg polymorphism in the TP53 gene: there were increased risks for developing severe POAG and elevated IOP in heterozygous or homozygous carriers of the mutated proapoptotic allele G (72Arg).
Key words: Primary open-angle glaucoma, Pro72Arg polymorphism in the TP53 gene, mathematical analysis, progression, intraocular pressure
Introduction
Primary open-angle glaucoma (POAG) accounts for 15% of Ukrainian persons newly certified as visually disabled [1]. In 2014, glaucoma was found to affect 212516 people aged 18 or older in the Ukrainian population, with a prevalence of 601.9 per 100,000 [2]. Until now, there is no clear and universally accepted definition of glaucoma. During most of the last century, elevated intraocular pressure (IOP) due to impeded outflow of aqueous humor in the anterior chamber was regarded as the major sign of glaucoma. Today, glaucoma is usually defined as an optic neuropathy, whereas insufficient outflow of aqueous humor and elevated IOP are referred to as risk factors for the disease [3, 4]. Increased attention is also given to activation of apoptosis of retinal ganglion cells which results in the development of glaucomatous neuropathy [5, 6]. Since protein p53 is a major regulator of apoptosis, the level of its activity depends not only on the level of TP53 gene expression, but also on TP53 polymorphisms, and it has been shown that p53 polymorphic variants at codon 72 exert different effects on protein activation and protein synthesis rate [7]. Association of TP53 polymorphisms with POAG have been demonstrated recently [8-10].
The study purpose was to analyze mathematically the effect of the Pro/Arg72 polymorphism in the TP53 gene on the emergence and progression of POAG.
Materials and Methods
The study group comprised 172 patients (78 men (45%) and 94 (55 %) women) diagnosed with POAG, and the control group comprised 98 individuals (46 men (47 %) and 52 women (53 %)) without POAG. The mean age of patients was 57.3±1.1 years at the time of the examination for POAG. At baseline, complaints were collected and detailed histories were taken, and patients underwent visual acuity testing, Humphrey perimetry, pneumotonometry, refractometry, biomicroscopy, gonioscopy, ophthalmoscopy and ocular coherence tomography (OCT). Thereafter, they underwent Disc Damage Likelihood Scale (DDLS) grading [11]. The examination was conducted at baseline, 12 months and 24 months.
A multiple logistic regression was used (a) to identify factors associated with the severity of the pathological process and with pathological changes over time, and (b) to assess the effect of these factors on dependent variables. To assess the severity of the pathological process, we used the following output variables: stage of POAG at presentation (Y1) (with Y1=1 for severe glaucomatous damage (stage 3 or stage 4 POAG), and Y1=0 for mild glaucomatous damage (stage 1 or stage 2 POAG)), and IOP category at presentation (IOT0, Y2) (with Y2=1 for high IOP category (IOT0=3), and Y2=0 for low IOP category (IOT0=1 or IOT0=2)). To assess the pathological changes over time, we used the following output variables: change in POAG stage over two years (Y1D) (with Y1D=1 for progression of disease or stage 4 POAG as early as at presentation, and Y1D =0 for no progression of disease over two years) and change in IOP category over two years (Y2D) (with Y2D=1 for progression of IOP category over two years or category 1 IOP as early as at presentation, and Y2D =0 for no progression of disease over two years). Sex, age, duration of disease, genotype, stage of POAG at presentation, and category of IOP at presentation (IOP0) were used as independent variables in the analysis. IOP categories were defined as per recommendations of Nesterov [12]: normal (category 1, up to 23 mmHg); moderately elevated (category 2, 23 mmHg to 32 mmHg); and elevated (category 3, 33 mmHg and above).
After an informed consent was obtained, a 2.5-ml blood sample was drawn from the cubital vein and collected into the Vacutainer System (Sarstedt, Germany). Polymorphic variants of TP53 gene were determined by real-time PCR using a TaqMan®SNP Genotyping Assay (Life Technologies, Grand Island, NY).
We estimated both the allele and the genotype frequencies of TP53 gene polymorphisms in the groups, and used Kruskal — Wallis one-way analysis of variance and F test to determine whether significant differences existed among the groups. Statistical analysis was performed using MedCalc v.15.11.0 (MedCalc Software bvba, 1993–2015).
Results and Discussion
Stage of POAG at presentation (Y1)
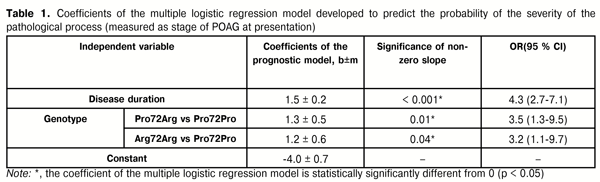
A multivariable model was developed using a backward stepwise selection procedure to select independent variables associated with the severity of the pathological process (measured as stage of POAG at presentation; exclusion threshold, P > 0.1). Two independent variables, duration of disease and genotype, were selected. The model was based on these variables, and the model fit was adequate (?2=70, p<0.001). The area under the receiver operating characteristics curve was statistically significantly higher than 0.5 (AUC=0.81, 95 % CI=0.75-0.87). Table 1 presents the results of the analysis of the association of stage of POAG at presentation with independent variables in a multiple logistic regression model.
A model for predicting the severity of pathological process (measured as stage of POAG at presentation) can be described by equation 1:
where Y1 is the probability of severe pathological process (measured as stage of POAG at presentation), T is duration of disease (years); KG is the coefficient which depends on the patient’s genotype (KG = 0 for Pro72Pro, KG = 1.3 for Pro72Arg, KG = 1.2 for Arg72Arg)
Multiple logistic regression model analysis revealed an association between the severity of the pathological process (measured as stage of POAG at presentation) and disease duration: the odds ratio of more severe disease increased more than fourfold with each 1-year increase in duration of disease (p < 0.001; OR = 4.3; 95 % CI = 2.7-7.1). After adjustment for other independent variables, patients with p53 Pro72Arg genotype had 3.5 times higher odds of a severe stage of POAG compared to those with Pro72Pro genotype (p=0.01, OR = 3.5 (95 % CI=1.3-9.5). In addition, patients with p53 Arg72Arg genotype had more than 3 times higher odds of developing a severe stage of POAG compared to those with Pro72Pro genotype (p=0.04, OR = 3.2, 95 % CI=1.1-9.7).
IOP category at presentation” (IOT0, Y2)
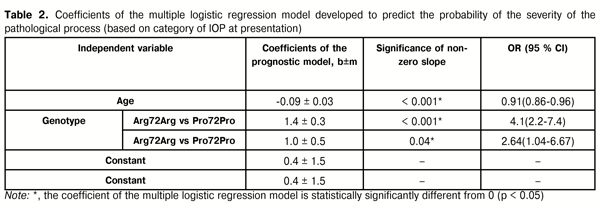
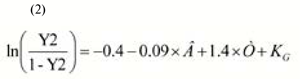
A multivariable model was developed using a backward stepwise selection procedure to select independent variables associated with the severity of the pathological process (based on the IOP category at presentation; exclusion threshold, P > 0.1). Three independent variables, age, duration of disease and genotype, were selected. The model was based on these variables, and the model fit was adequate (?2=62.8, p<0.001). The area under the receiver operating characteristics curve was statistically significantly higher than 0.5 (AUC=0.87, 95 % CI=0.81-0.91). Table 2 presents the results of the analysis of the association of category of IOP at presentation with independent variables in a multiple logistic regression model. A model for predicting the severity of pathological process (based on the category of IOP at presentation) can be described by equation 2:

where Y2 is the probability of severe pathological process (based on the category of IOP at presentation), T is duration of disease (years); B is patient’s age (years); KG is the coefficient which depends on the patient’s genotype (KG = 0 for Pro72Pro and Pro72Arg, KG = 1.3 for, KG = 1.0 for Arg72Arg)
Multiple logistic regression model analysis revealed an association between the severity of the pathological process (based on the category of IOP at presentation) and patient’s age: the risk of elevated IOP decreased with each 1-year increase in patient’s age (p < 0.001; OR = 0.91; 95 % CI = 0.86-0.96). After adjustment for age, the odds of a severe stage of POAG at presentation increased more than 4 times with each 1-year increase in duration of disease (p<0.01, OR =4.1 (95 % CI=2.2-7.4). After adjustment for other independent variables, patients with p53 Arg72Arg genotype had 2.64 times higher odds of a more advanced IOP category compared to those with Pro72Arg or Pro72Pro genotype (p=0.04, OR = 2.64; 95 % CI=1.04-6.67).
Change in POAG stage over two years (Y1D)
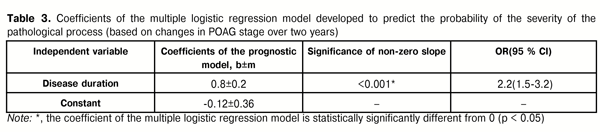
A multivariable model was developed using a backward stepwise selection procedure to select independent variables associated with any progression in the development of the pathological process (based on the changes in POAG stage over two years; exclusion threshold, P > 0.1). Only one independent variable, age, was selected. The model was based on this variable, and the model fit was adequate (?2=21.1; p<0.001). The area under the receiver operating characteristics curve was statistically significantly higher than 0.5 (AUC=0.77, 95 % CI=0.70-0.83). Table 3 presents the results of the analysis of the association of the changes in stage of POAG over two years with independent variables in a multiple logistic regression model. A model for predicting the progression in the development of the pathological process (based on the changes in POAG stage over two years) can be described by equation 3:
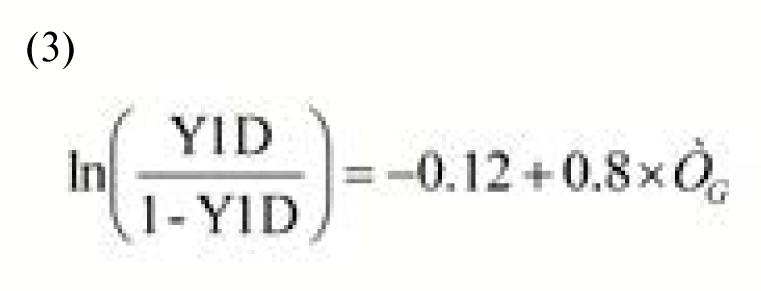
where Y1D is the probability of any progression in the development of the pathological process (based on the changes in POAG stage over two years), T is duration of disease (years)
Multiple logistic regression model analysis revealed an association between the changes in POAG stage over two years and duration of disease: the odds of developing a more advanced stage of POAG increased more than twofold with each 1-year increase in duration of disease (p < 0.001; OR = 2.2; 95 % CI = 1.5-3.2). The cut-off value based on ROC curve analysis was >0 years, with a little progress in the process only at the onset of disease.
Change in IOP category over two years (Y2D)
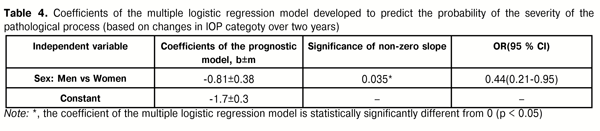
A multivariable model was developed using a backward stepwise selection procedure to select independent variables associated with any progression in the development of the pathological process (based on the changes in IOP category over two years; exclusion threshold, P > 0.1). Only one independent variable, patient’s sex, was selected. The model was based on this variable, and the model fit was adequate (?2=4.6; p=0.03). The area under the receiver operating characteristics curve was statistically significantly (p < 0.001) higher than 0.5 (AUC=0.60, 95 % CI=0.52-0.67). Table 4 presents the results of the analysis of the association of the changes in IOP category over two years with independent variables in a multiple logistic regression model. A model for predicting the progression in the development of the pathological process (based on the changes in IOP category over two years) can be described by equation 4:
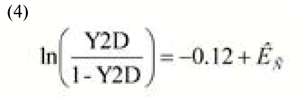
where Y2D is the probability of any progression in the development of the pathological process (based on the changes in IOP category over two years); KС is the coefficient depending on patient sex (KС = 0 for women, KC = -0.81 for men)
Multiple logistic regression model analysis revealed an association between the changes in IOP category over two years and patient sex: men had 2.3 times lower odds of developing a more advanced category of IOP compared with women (p = 0.035; OR = 0.44; 95 % CI = 0.21-0.95).
Conclusions
First, the study found some patterns in the emergence and progression of POAG. It revealed associations between the severity of the pathological process (measured as stage of POAG at presentation) and disease duration, and between the severity and disease genotype. After adjustment for other independent variables, patients with p53 Pro72Arg genotype had 3.5 times higher odds of a severe stage of POAG compared to those with Pro72Pro genotype (p=0.01, OR = 3.5 (95 % CI=1.3-9.5).
Second, patients with p53 Arg72Arg genotype had more than 3 times higher odds of developing a severe stage of POAG compared to those with Pro72Pro genotype (p=0.04, OR = 3.2, 95 % CI=1.1-9.7).
Third, we demonstrated an association between the severity of the pathological process (based on the category of IOP at presentation) and patient’s age. After adjustment for other independent variables, patients with p53 Arg72Arg genotype had 2.64 times higher odds of a more advanced IOP category compared to those with Pro72Arg or Pro72Pro genotype (p=0.04, OR = 2.64; 95 % CI=1.04-6.67). No association was revealed between the indices of progression of pathological process and genotype.
Finally, we revealed an association between the changes in POAG stage over two years and duration of disease: the odds of developing a more advanced stage of POAG increased more than twofold with each 1-year increase in duration of disease (p < 0.001; OR = 2.2; 95 % CI = 1.5-3.2). Men had 2.3 times lower odds of developing a more advanced category of IOP compared with women (p = 0.035; OR = 0.44; 95 % CI = 0.21-0.95).
References
1. S.I. Cherniak, editor. [Main 2014 annual indices of disability and activity of medical-and-social expert commissions of Ukraine. Information and analytical reference book]. Dnipropetrovsk: Aktsent Private Enterprise; 2015. 167 p. Russian
2. Golubchikov MV, Rykov SO, Vitovska OP, et al. [Ophthalmological care in Ukraine in 2005-2014. Analytical and statistical reference book]. Kyiv: Logos; 2015. 230 p. Ukrainian
3. Zavgorodniaia NG, Pasyechnikova NV. [Primary glaucoma: A new look at an old problem]. Zaporizhzhia: Orbita-YUG; 2010 Russian
4. Nesterov AP. [Pathogenesis and issues of pathogenetic treatment of glaucoma]. Klinicheskaya ofralmologiya. 2003;2:47–8 Russian
5. Aleksandrovska LK, Penishkevych IaI. [Primary open-angle glaucoma: pathogenesis]. Molodyi vchenyi. 2014;3(06):108–10 Ukrainian
6. Belousova AI, Vitkovskii IuA. [Genetic apoptotic mechanisms in the pathogenesis of primary open-angle glaucoma]. Dalnevostochnyi meditsinskii zhurnal. 2008; 4:113–15 Russian
7. Dumont P, Leu JL, Della Pietra AC, et al. The codon 72 polymorphic variants of p53 have markedly different apoptotic potential. Nat Genet. 2003; 33(3):357–65
Crossref Pubmed
8. Logunov NA, Belousova AI, Vitkovskii IuA. [Role of proaptotic polymorphism p53 (C72G) in the pathogenesis of open-angle glaucoma in residents of Transbaikalian region]. Kubanskii meditsinskii vestnik. 2011; 3:97–100
9. Ressiniotis T, Griffiths PG, Birch M, et al. Primary open angle glaucoma is associated with a specific p53 gene haplotype. J Med Genet. 2004;41:296–8
Crossref Pubmed
10. Acharya M, Mitra S, Mukhopadhyay A, et al. Distribution of p53 codon 72 polymorphism in Indian primary open angle glaucoma patients. Mol Vis. 2002 Sep 30;8:367–71
11. Flammer J. Glaucoma – a guide for patients, an introduction for care providers, a quick reference. Bern: Huber; 2001
12. Nesterov AP. [Glaucoma]. Moscow: Meditsinskoye Informatsionnoye Agenstvo; 2008 Russian